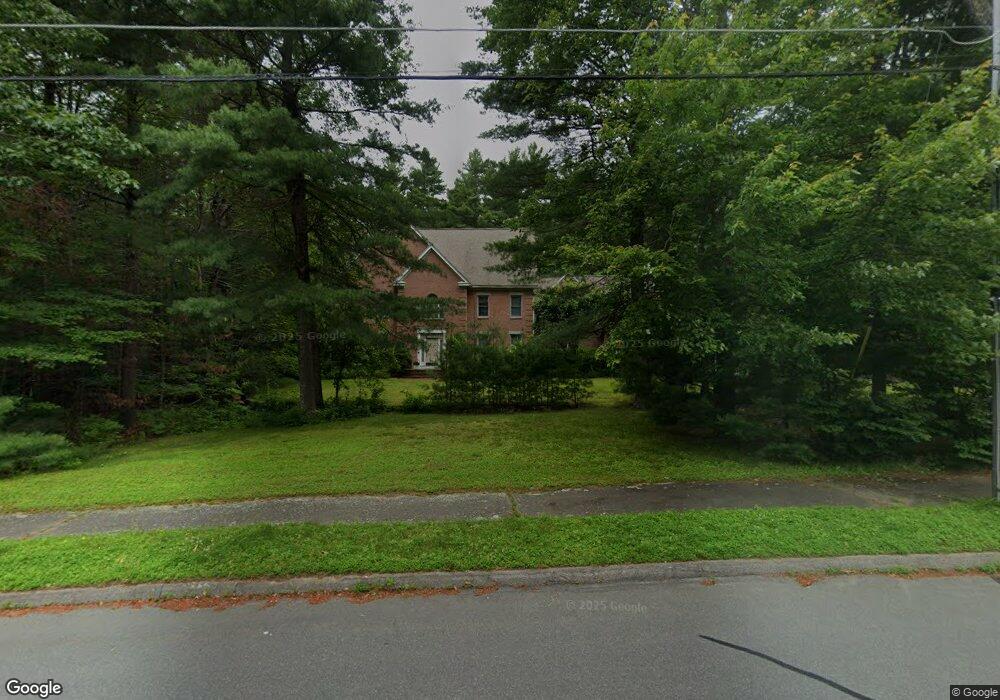
47 Wagon Rd Walpole, MA 02081
Estimated Value: $1,752,604 - $2,554,000
5
Beds
4
Baths
5,488
Sq Ft
$365/Sq Ft
Est. Value
About This Home
This home is located at 47 Wagon Rd, Walpole, MA 02081 and is currently estimated at $2,005,651, approximately $365 per square foot. 47 Wagon Rd is a home located in Norfolk County with nearby schools including Fisher School, Walpole Middle School, and Walpole High School.
Ownership History
Date
Name
Owned For
Owner Type
Purchase Details
Closed on
Feb 28, 2001
Sold by
Genest Suzanne D
Bought by
Leveckis Renald
Current Estimated Value
Home Financials for this Owner
Home Financials are based on the most recent Mortgage that was taken out on this home.
Original Mortgage
$775,000
Outstanding Balance
$281,777
Interest Rate
7%
Mortgage Type
Purchase Money Mortgage
Estimated Equity
$1,723,874
Create a Home Valuation Report for This Property
The Home Valuation Report is an in-depth analysis detailing your home's value as well as a comparison with similar homes in the area
Home Values in the Area
Average Home Value in this Area
Purchase History
| Date | Buyer | Sale Price | Title Company |
|---|---|---|---|
| Leveckis Renald | $900,000 | -- |
Source: Public Records
Mortgage History
| Date | Status | Borrower | Loan Amount |
|---|---|---|---|
| Open | Leveckis Renald | $775,000 | |
| Previous Owner | Leveckis Renald | $382,000 |
Source: Public Records
Tax History Compared to Growth
Tax History
| Year | Tax Paid | Tax Assessment Tax Assessment Total Assessment is a certain percentage of the fair market value that is determined by local assessors to be the total taxable value of land and additions on the property. | Land | Improvement |
|---|---|---|---|---|
| 2025 | $21,595 | $1,683,200 | $428,400 | $1,254,800 |
| 2024 | $20,733 | $1,568,300 | $412,100 | $1,156,200 |
| 2023 | $19,008 | $1,368,500 | $358,200 | $1,010,300 |
| 2022 | $17,193 | $1,189,000 | $331,700 | $857,300 |
| 2021 | $16,971 | $1,143,600 | $313,000 | $830,600 |
| 2020 | $15,768 | $1,051,900 | $305,700 | $746,200 |
| 2019 | $15,663 | $1,037,300 | $294,400 | $742,900 |
| 2018 | $16,206 | $1,061,300 | $282,400 | $778,900 |
| 2017 | $15,782 | $1,029,500 | $271,500 | $758,000 |
| 2016 | $15,776 | $1,013,900 | $290,800 | $723,100 |
| 2015 | $15,797 | $1,006,200 | $287,500 | $718,700 |
| 2014 | $15,085 | $957,200 | $287,500 | $669,700 |
Source: Public Records
Map
Nearby Homes
- 17 Bridle Path
- 111 Elm St
- 94 Elm St
- 44 Millbrook Ave
- 4 Lost Brook Trail
- 19 and 23 Arlington Ln
- 15 Belknap Rd
- 40 Hearthstone Dr
- 1080 North St
- 23 Bubbling Brook Rd
- 11 Garry Dr
- 18 Tisdale Dr Unit 18
- 70 Gould St
- 9 Schaffner Ln
- 16 Albemarle Rd
- 435 Main St Unit B
- 9 Stonegate Dr
- 11 Stonegate Dr
- 90 Blueberry Ln
- 26 Arcadia Rd