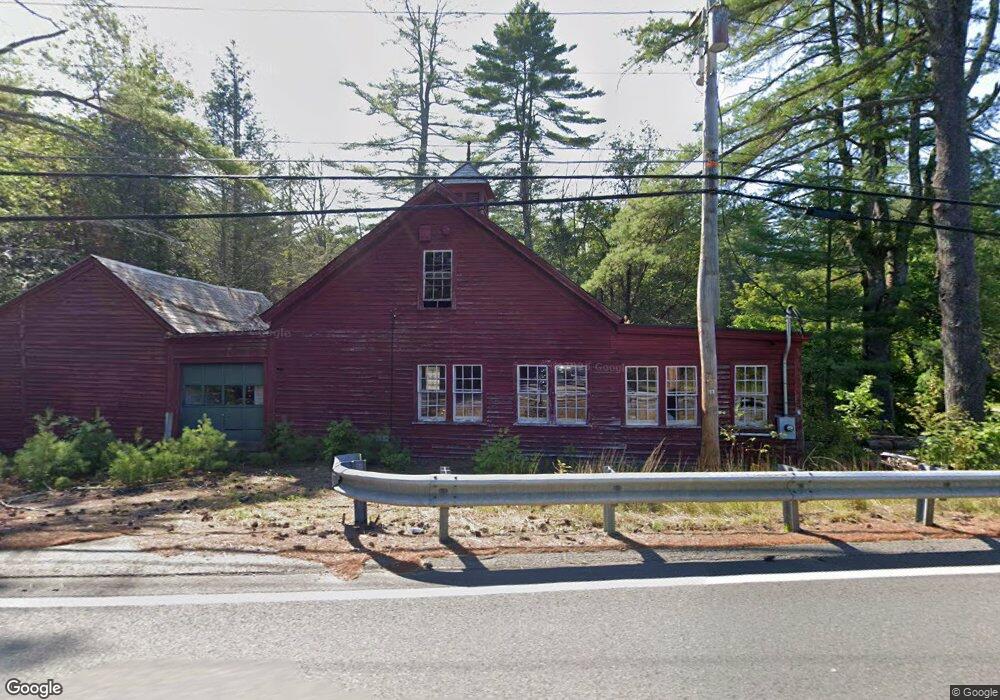
47 Warwick Rd Orange, MA 01364
Estimated Value: $430,000 - $565,000
6
Beds
3
Baths
4,521
Sq Ft
$116/Sq Ft
Est. Value
About This Home
This home is located at 47 Warwick Rd, Orange, MA 01364 and is currently estimated at $523,271, approximately $115 per square foot. 47 Warwick Rd is a home located in Franklin County with nearby schools including Fisher Hill and Ralph C Mahar Regional School.
Ownership History
Date
Name
Owned For
Owner Type
Purchase Details
Closed on
Jun 3, 2010
Sold by
Harris Glenys M and Harris Edward S
Bought by
Nautilus Water Mill Ll
Current Estimated Value
Home Financials for this Owner
Home Financials are based on the most recent Mortgage that was taken out on this home.
Original Mortgage
$64,000
Outstanding Balance
$43,993
Interest Rate
5.5%
Mortgage Type
Adjustable Rate Mortgage/ARM
Estimated Equity
$479,278
Create a Home Valuation Report for This Property
The Home Valuation Report is an in-depth analysis detailing your home's value as well as a comparison with similar homes in the area
Home Values in the Area
Average Home Value in this Area
Purchase History
| Date | Buyer | Sale Price | Title Company |
|---|---|---|---|
| Nautilus Water Mill Ll | -- | -- | |
| Macleod Cameron | $59,999 | -- |
Source: Public Records
Mortgage History
| Date | Status | Borrower | Loan Amount |
|---|---|---|---|
| Open | Macleod Cameron | $64,000 |
Source: Public Records
Tax History
| Year | Tax Paid | Tax Assessment Tax Assessment Total Assessment is a certain percentage of the fair market value that is determined by local assessors to be the total taxable value of land and additions on the property. | Land | Improvement |
|---|---|---|---|---|
| 2025 | $87 | $530,600 | $37,500 | $493,100 |
| 2024 | $7,166 | $410,900 | $37,500 | $373,400 |
| 2023 | $6,381 | $355,300 | $37,500 | $317,800 |
| 2022 | $6,549 | $342,500 | $37,500 | $305,000 |
| 2021 | $5,554 | $277,000 | $54,100 | $222,900 |
| 2020 | $5,579 | $274,400 | $53,700 | $220,700 |
| 2019 | $5,427 | $241,000 | $46,800 | $194,200 |
| 2018 | $5,189 | $236,500 | $43,800 | $192,700 |
| 2017 | $5,097 | $240,100 | $43,800 | $196,300 |
| 2016 | $4,776 | $220,100 | $43,800 | $176,300 |
| 2015 | $4,655 | $224,100 | $43,800 | $180,300 |
| 2014 | $4,471 | $226,500 | $43,800 | $182,700 |
Source: Public Records
Map
Nearby Homes
- 44 Moss Brook Rd
- 56 Shelter St
- 30 Cottage St
- 30 Stone Valley Rd
- 166-168 W Main St
- 222 W River St
- 83 W Main St
- 36 Summit St Unit A
- 36 Summit St Unit B
- 49 Lincoln Ave
- 67 Putnam St
- 12-14 E Main St
- 50 E Main St
- 58 E Main St
- 216 Holtshire Rd
- 150 E Main St
- 313-315 Walnut Hill Rd
- 270 S Main St
- 246 Holtshire Rd Unit Lot 3
- 490 S Main St
Your Personal Tour Guide
Ask me questions while you tour the home.