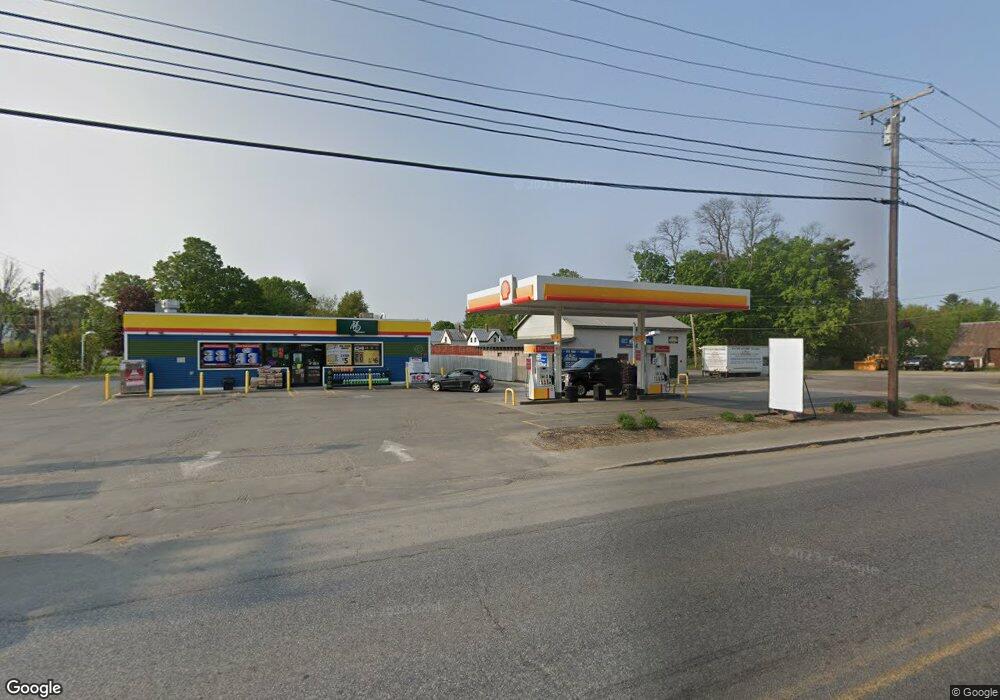
47 Waterville Rd Skowhegan, ME 04976
Estimated Value: $370,192
3
Beds
2
Baths
2,750
Sq Ft
$135/Sq Ft
Est. Value
About This Home
This home is located at 47 Waterville Rd, Skowhegan, ME 04976 and is currently estimated at $370,192, approximately $134 per square foot. 47 Waterville Rd is a home located in Somerset County with nearby schools including Creative Children's Academy, Overman Academy, and Faith Baptist Christian School.
Ownership History
Date
Name
Owned For
Owner Type
Purchase Details
Closed on
Aug 11, 2022
Sold by
Cn Brown Co
Bought by
Star Energy
Current Estimated Value
Home Financials for this Owner
Home Financials are based on the most recent Mortgage that was taken out on this home.
Original Mortgage
$240,000
Outstanding Balance
$229,190
Interest Rate
5.7%
Mortgage Type
Purchase Money Mortgage
Estimated Equity
$141,002
Create a Home Valuation Report for This Property
The Home Valuation Report is an in-depth analysis detailing your home's value as well as a comparison with similar homes in the area
Home Values in the Area
Average Home Value in this Area
Purchase History
| Date | Buyer | Sale Price | Title Company |
|---|---|---|---|
| Star Energy | -- | None Available | |
| Star Energy | -- | None Available |
Source: Public Records
Mortgage History
| Date | Status | Borrower | Loan Amount |
|---|---|---|---|
| Open | Star Energy | $240,000 | |
| Closed | Star Energy | $240,000 |
Source: Public Records
Tax History Compared to Growth
Tax History
| Year | Tax Paid | Tax Assessment Tax Assessment Total Assessment is a certain percentage of the fair market value that is determined by local assessors to be the total taxable value of land and additions on the property. | Land | Improvement |
|---|---|---|---|---|
| 2024 | $5,811 | $321,600 | $94,300 | $227,300 |
| 2023 | $5,699 | $321,600 | $94,300 | $227,300 |
| 2022 | $5,127 | $293,300 | $66,000 | $227,300 |
| 2021 | $5,382 | $293,300 | $66,000 | $227,300 |
| 2020 | $5,279 | $293,300 | $66,000 | $227,300 |
| 2019 | $5,056 | $293,300 | $66,000 | $227,300 |
| 2018 | $5,338 | $293,300 | $66,000 | $227,300 |
| 2017 | $5,866 | $293,300 | $66,000 | $227,300 |
| 2016 | $5,611 | $294,700 | $65,800 | $228,900 |
| 2015 | $5,393 | $294,700 | $65,800 | $228,900 |
| 2014 | $5,054 | $294,700 | $65,800 | $228,900 |
| 2013 | $4,833 | $294,700 | $65,800 | $228,900 |
Source: Public Records
Map
Nearby Homes
- 1 Waterville Rd
- 39 Joyce St
- 14 Dinsmore St
- 17 Heselton St
- 18 Leavitt St
- 24 Pleasant St
- 7 Dartmouth St
- 21 Pine St
- 26 Pleasant St
- 11 Summer St
- 39 Pleasant St
- 32 E Maple St
- 131 Madison Ave
- 86 North Ave
- 18 Maple St
- M33 L94-1 (Lot 17 & 18) Reed St
- M33 L94-1 (Lot 17) Reed St
- 50 Saint Mark St
- 36 Saint Mark St
- 10 Greenwood Ave