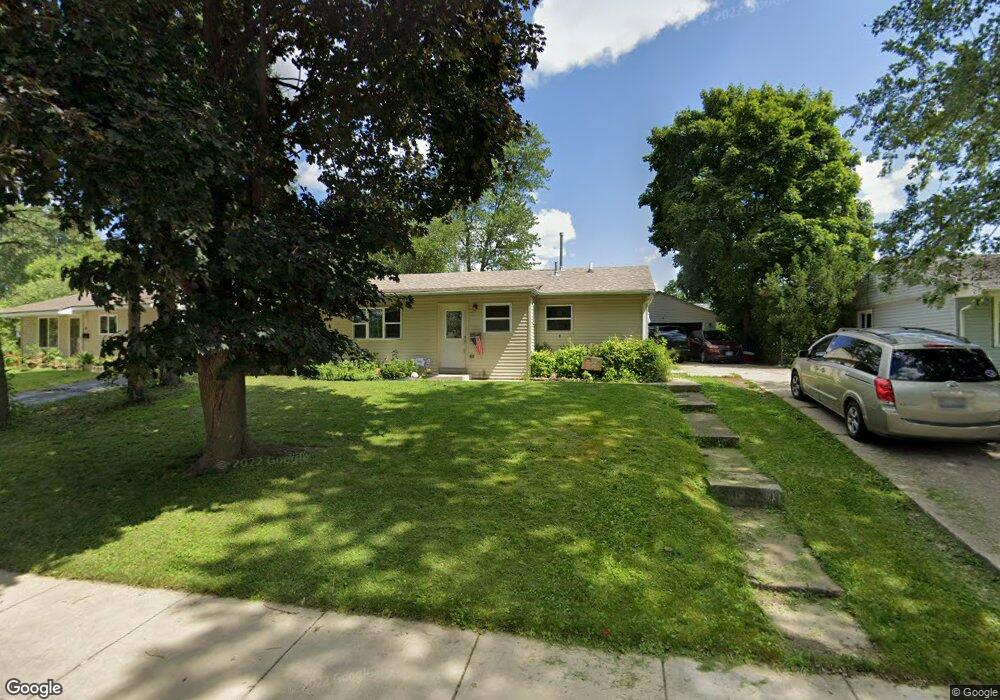
47 Wren Rd Carpentersville, IL 60110
Estimated Value: $231,000 - $254,378
3
Beds
1
Bath
960
Sq Ft
$253/Sq Ft
Est. Value
About This Home
This home is located at 47 Wren Rd, Carpentersville, IL 60110 and is currently estimated at $243,345, approximately $253 per square foot. 47 Wren Rd is a home located in Kane County with nearby schools including Meadowdale Elementary School, Carpentersville Middle School, and Dundee-Crown High School.
Ownership History
Date
Name
Owned For
Owner Type
Purchase Details
Closed on
Nov 1, 2016
Sold by
Chicago Litle Land Trust Company
Bought by
Gonzalez Jose
Current Estimated Value
Home Financials for this Owner
Home Financials are based on the most recent Mortgage that was taken out on this home.
Original Mortgage
$130,758
Outstanding Balance
$105,240
Interest Rate
3.5%
Mortgage Type
FHA
Estimated Equity
$138,105
Purchase Details
Closed on
Apr 9, 2010
Sold by
Wells Fargo Bank Na
Bought by
Morovati Mohammad
Purchase Details
Closed on
Oct 19, 2009
Sold by
Zepeda Mariano
Bought by
Wachovia Mortgage Fsb and World Savings Bank
Purchase Details
Closed on
Apr 16, 2001
Sold by
Janowiak Mark
Bought by
Zepeda Mariano
Home Financials for this Owner
Home Financials are based on the most recent Mortgage that was taken out on this home.
Original Mortgage
$110,200
Interest Rate
6.95%
Mortgage Type
Stand Alone First
Create a Home Valuation Report for This Property
The Home Valuation Report is an in-depth analysis detailing your home's value as well as a comparison with similar homes in the area
Home Values in the Area
Average Home Value in this Area
Purchase History
| Date | Buyer | Sale Price | Title Company |
|---|---|---|---|
| Gonzalez Jose | $134,000 | Chicago Title Land Trust Co | |
| Morovati Mohammad | $30,000 | Premier Title | |
| Wachovia Mortgage Fsb | -- | None Available | |
| Zepeda Mariano | $116,000 | Ticor Title Insurance |
Source: Public Records
Mortgage History
| Date | Status | Borrower | Loan Amount |
|---|---|---|---|
| Open | Gonzalez Jose | $130,758 | |
| Previous Owner | Zepeda Mariano | $110,200 |
Source: Public Records
Tax History Compared to Growth
Tax History
| Year | Tax Paid | Tax Assessment Tax Assessment Total Assessment is a certain percentage of the fair market value that is determined by local assessors to be the total taxable value of land and additions on the property. | Land | Improvement |
|---|---|---|---|---|
| 2024 | $5,320 | $70,244 | $12,553 | $57,691 |
| 2023 | $5,310 | $63,203 | $11,295 | $51,908 |
| 2022 | $4,699 | $53,965 | $11,295 | $42,670 |
| 2021 | $4,616 | $50,954 | $10,665 | $40,289 |
| 2020 | $4,550 | $49,808 | $10,425 | $39,383 |
| 2019 | $4,474 | $47,284 | $9,897 | $37,387 |
| 2018 | $4,049 | $40,801 | $9,701 | $31,100 |
| 2017 | $3,915 | $38,168 | $9,075 | $29,093 |
| 2016 | $3,618 | $32,884 | $8,787 | $24,097 |
| 2015 | -- | $25,752 | $8,234 | $17,518 |
| 2014 | -- | $23,216 | $8,007 | $15,209 |
| 2013 | -- | $23,927 | $8,252 | $15,675 |
Source: Public Records
Map
Nearby Homes