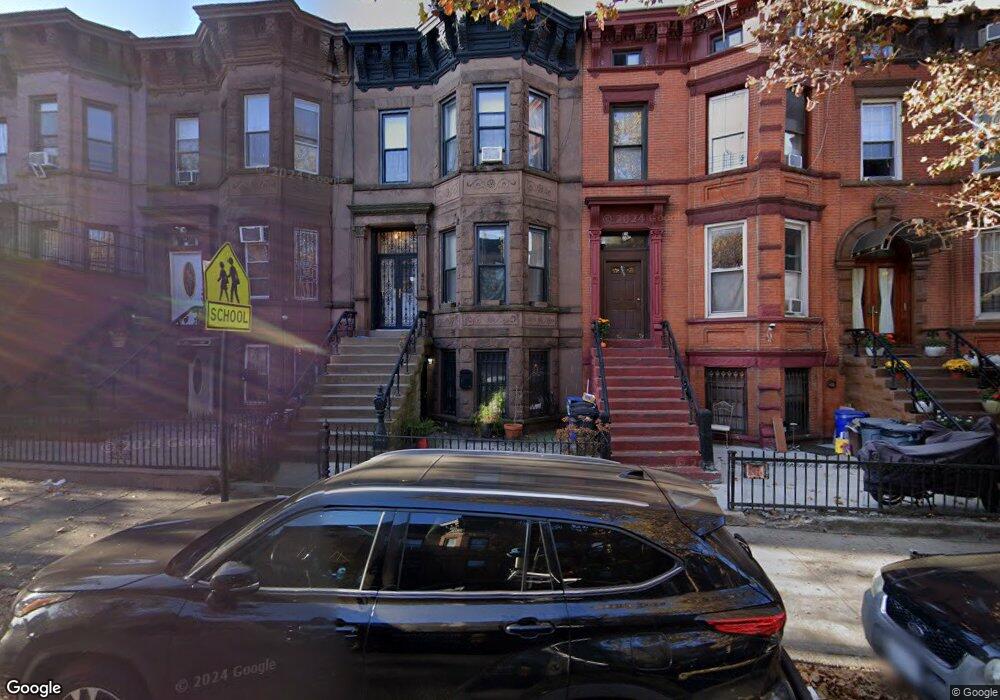
470 54th St Brooklyn, NY 11220
Sunset Park NeighborhoodEstimated Value: $1,349,407 - $1,602,000
Studio
--
Bath
2,820
Sq Ft
$539/Sq Ft
Est. Value
About This Home
This home is located at 470 54th St, Brooklyn, NY 11220 and is currently estimated at $1,519,602, approximately $538 per square foot. 470 54th St is a home located in Kings County with nearby schools including P.S. 503: The School of Discovery, IS 220 John J. Pershing, and Fort Hamilton High School.
Ownership History
Date
Name
Owned For
Owner Type
Purchase Details
Closed on
Dec 20, 2024
Sold by
Hernandez Miguel and Hernandez Miguel
Bought by
470 54 Street Llc
Current Estimated Value
Purchase Details
Closed on
Apr 13, 2005
Sold by
Wang Mei Jiao and Zhou Qiu Fang
Bought by
Hernandez Miguel and Hernandez Nelson
Purchase Details
Closed on
Oct 29, 2004
Sold by
Colon Gloria and Colon Lisa
Bought by
Fang Zhou Qiu and Jiao Wang Mei
Purchase Details
Closed on
Oct 28, 1996
Sold by
Chen Ray Wei Xiong
Bought by
Colon Jose
Create a Home Valuation Report for This Property
The Home Valuation Report is an in-depth analysis detailing your home's value as well as a comparison with similar homes in the area
Home Values in the Area
Average Home Value in this Area
Purchase History
| Date | Buyer | Sale Price | Title Company |
|---|---|---|---|
| 470 54 Street Llc | -- | -- | |
| 470 54 Street Llc | -- | -- | |
| Hernandez Miguel | $575,000 | -- | |
| Hernandez Miguel | $575,000 | -- | |
| Fang Zhou Qiu | $410,000 | -- | |
| Fang Zhou Qiu | $410,000 | -- | |
| Colon Jose | $145,000 | -- | |
| Colon Jose | $145,000 | -- |
Source: Public Records
Tax History
| Year | Tax Paid | Tax Assessment Tax Assessment Total Assessment is a certain percentage of the fair market value that is determined by local assessors to be the total taxable value of land and additions on the property. | Land | Improvement |
|---|---|---|---|---|
| 2025 | $6,997 | $81,420 | $16,620 | $64,800 |
| 2024 | $6,997 | $81,420 | $16,620 | $64,800 |
| 2023 | $7,075 | $94,860 | $16,620 | $78,240 |
| 2022 | $6,901 | $87,660 | $16,620 | $71,040 |
| 2021 | $6,864 | $79,320 | $16,620 | $62,700 |
| 2020 | $3,219 | $79,500 | $16,620 | $62,880 |
| 2019 | $6,073 | $81,900 | $16,620 | $65,280 |
| 2018 | $5,918 | $29,030 | $8,114 | $20,916 |
| 2017 | $5,873 | $28,809 | $6,498 | $22,311 |
| 2016 | $5,434 | $27,180 | $7,367 | $19,813 |
| 2015 | $3,278 | $25,642 | $8,126 | $17,516 |
| 2014 | $3,278 | $24,192 | $8,074 | $16,118 |
Source: Public Records
Map
Nearby Homes
Your Personal Tour Guide
Ask me questions while you tour the home.