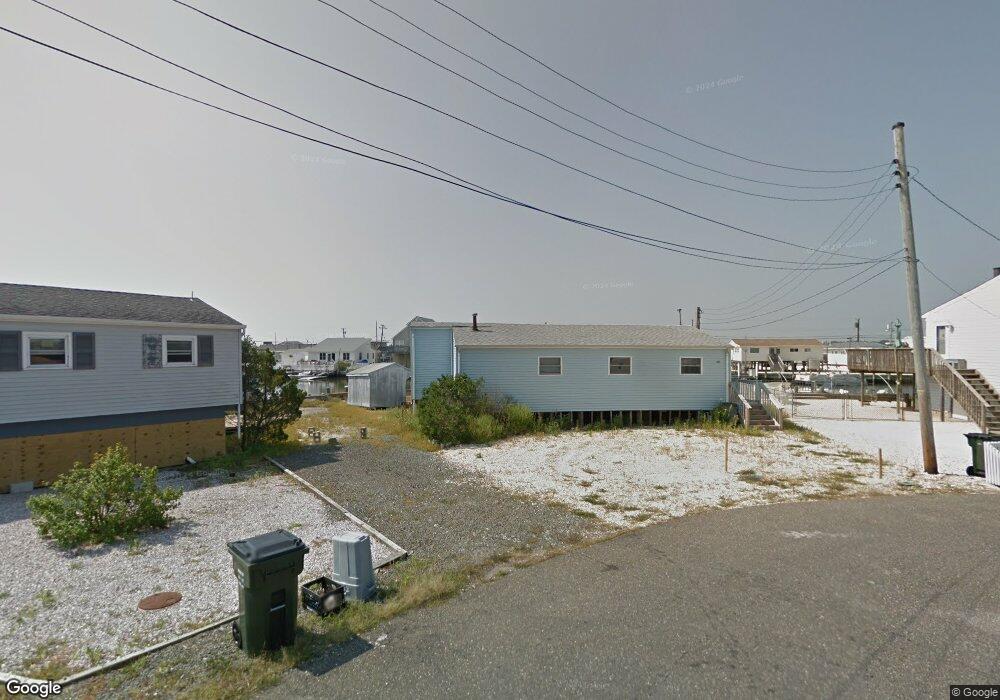
470 Anchor Ave Tuckerton, NJ 08087
Estimated Value: $527,000 - $841,000
3
Beds
1
Bath
1,026
Sq Ft
$720/Sq Ft
Est. Value
About This Home
This home is located at 470 Anchor Ave, Tuckerton, NJ 08087 and is currently estimated at $738,798, approximately $720 per square foot. 470 Anchor Ave is a home located in Ocean County with nearby schools including Tuckerton Elementary School, Pinelands Regional Junior High School, and Pinelands Regional High School.
Ownership History
Date
Name
Owned For
Owner Type
Purchase Details
Closed on
Jul 30, 2009
Sold by
Achtau Properties Llc
Bought by
Chiang Louie and Chiang Terese
Current Estimated Value
Home Financials for this Owner
Home Financials are based on the most recent Mortgage that was taken out on this home.
Original Mortgage
$184,500
Interest Rate
4.78%
Mortgage Type
Purchase Money Mortgage
Purchase Details
Closed on
Jun 11, 2004
Sold by
Achtau Max L and Achtau Max L
Bought by
Achtau Properties Llc
Purchase Details
Closed on
Jan 13, 2004
Sold by
Ferraro Amy C
Bought by
Achtau Max L and Achtau Ii Max L
Home Financials for this Owner
Home Financials are based on the most recent Mortgage that was taken out on this home.
Original Mortgage
$150,000
Interest Rate
5.89%
Create a Home Valuation Report for This Property
The Home Valuation Report is an in-depth analysis detailing your home's value as well as a comparison with similar homes in the area
Home Values in the Area
Average Home Value in this Area
Purchase History
| Date | Buyer | Sale Price | Title Company |
|---|---|---|---|
| Chiang Louie | $246,000 | None Available | |
| Achtau Properties Llc | -- | -- | |
| Achtau Max L | $200,000 | -- |
Source: Public Records
Mortgage History
| Date | Status | Borrower | Loan Amount |
|---|---|---|---|
| Closed | Chiang Louie | $184,500 | |
| Previous Owner | Achtau Max L | $150,000 |
Source: Public Records
Tax History
| Year | Tax Paid | Tax Assessment Tax Assessment Total Assessment is a certain percentage of the fair market value that is determined by local assessors to be the total taxable value of land and additions on the property. | Land | Improvement |
|---|---|---|---|---|
| 2025 | $13,179 | $425,400 | $113,300 | $312,100 |
| 2024 | $12,005 | $425,400 | $113,300 | $312,100 |
Source: Public Records
Map
Nearby Homes
- 14 Parker Rd
- 389 Kingfisher Rd
- 25 Carroll Ave
- 27 Parker Rd
- 385 Kingfisher Rd
- 186 Flamingo Rd
- 79 Dolphin Rd
- 348 Kingfisher Rd
- 81 Dolphin Rd
- 370 Kingfisher Rd
- 64 Little Egg Harbor Blvd
- 163 Flamingo Rd
- 267 Heron Rd
- 476 S Green St
- 67 Flax Isle Dr
- 40 Daddy Tucker Dr
- 31 Daddy Tucker Dr
- 5 Hunter Dr
- 11 Lucille Ct
- 11 Greenbriar Dr
- 471 Anchor Ave
- 469 Anchor Ave
- 468 Anchor Ave
- 472 Anchor Ave
- 467and466 Anchor Ave
- 473 Anchor Ave
- 474 Anchor Ave
- 475 Anchor Ave
- 927 S Green St
- 925 S Green St
- 929 S Green St
- 466 Anchor Ave
- 923 S Green St
- 931 S Green St
- 408 Kingfisher Rd
- 407 Kingfisher Rd
- 476 Anchor Ave
- 409 Kingfisher Rd
- 406 Kingfisher Rd
- 921 S Green St