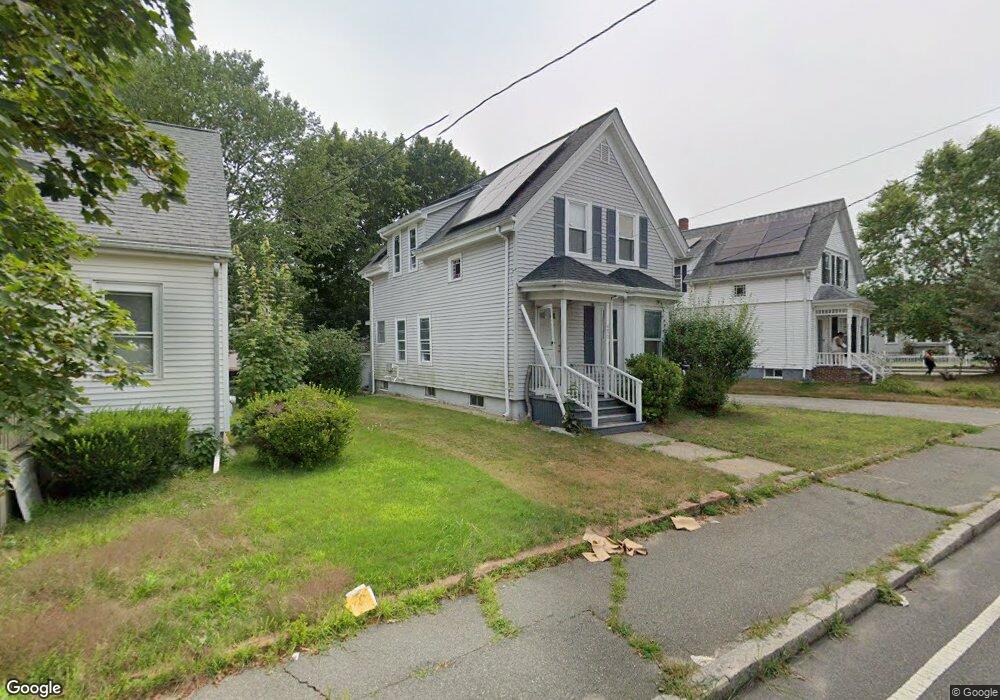
470 Ash St Brockton, MA 02301
Clifton Heights NeighborhoodEstimated Value: $493,000 - $508,000
3
Beds
2
Baths
1,700
Sq Ft
$294/Sq Ft
Est. Value
About This Home
This home is located at 470 Ash St, Brockton, MA 02301 and is currently estimated at $499,689, approximately $293 per square foot. 470 Ash St is a home located in Plymouth County with nearby schools including Manthala George Jr. School, Louis F Angelo Elementary School, and Raymond K-8 Elementary School.
Ownership History
Date
Name
Owned For
Owner Type
Purchase Details
Closed on
Mar 1, 2004
Sold by
Smellie Pauline and Smellie Derrick
Bought by
Varela Jorge R
Current Estimated Value
Home Financials for this Owner
Home Financials are based on the most recent Mortgage that was taken out on this home.
Original Mortgage
$213,750
Outstanding Balance
$99,757
Interest Rate
5.65%
Mortgage Type
Purchase Money Mortgage
Estimated Equity
$399,932
Purchase Details
Closed on
Mar 24, 2000
Sold by
Shaw Thelma S
Bought by
Blake Pauline and Smellie Derrick
Home Financials for this Owner
Home Financials are based on the most recent Mortgage that was taken out on this home.
Original Mortgage
$140,238
Interest Rate
8.31%
Mortgage Type
Purchase Money Mortgage
Create a Home Valuation Report for This Property
The Home Valuation Report is an in-depth analysis detailing your home's value as well as a comparison with similar homes in the area
Home Values in the Area
Average Home Value in this Area
Purchase History
| Date | Buyer | Sale Price | Title Company |
|---|---|---|---|
| Varela Jorge R | $225,000 | -- | |
| Blake Pauline | $146,000 | -- |
Source: Public Records
Mortgage History
| Date | Status | Borrower | Loan Amount |
|---|---|---|---|
| Open | Blake Pauline | $213,750 | |
| Previous Owner | Blake Pauline | $158,400 | |
| Previous Owner | Blake Pauline | $140,238 |
Source: Public Records
Tax History Compared to Growth
Tax History
| Year | Tax Paid | Tax Assessment Tax Assessment Total Assessment is a certain percentage of the fair market value that is determined by local assessors to be the total taxable value of land and additions on the property. | Land | Improvement |
|---|---|---|---|---|
| 2025 | $5,009 | $413,600 | $137,100 | $276,500 |
| 2024 | $4,727 | $393,300 | $137,100 | $256,200 |
| 2023 | $4,839 | $372,800 | $102,400 | $270,400 |
| 2022 | $4,233 | $303,000 | $92,900 | $210,100 |
| 2021 | $4,040 | $278,600 | $76,900 | $201,700 |
| 2020 | $3,848 | $254,000 | $72,400 | $181,600 |
| 2019 | $3,773 | $242,800 | $70,200 | $172,600 |
| 2018 | $3,479 | $216,600 | $70,200 | $146,400 |
| 2017 | $3,521 | $218,700 | $70,200 | $148,500 |
| 2016 | $2,998 | $172,700 | $68,000 | $104,700 |
| 2015 | $2,732 | $150,500 | $68,000 | $82,500 |
| 2014 | $2,834 | $156,300 | $68,000 | $88,300 |
Source: Public Records
Map
Nearby Homes