Estimated Value: $255,000 - $314,000
4
Beds
2
Baths
1,479
Sq Ft
$192/Sq Ft
Est. Value
About This Home
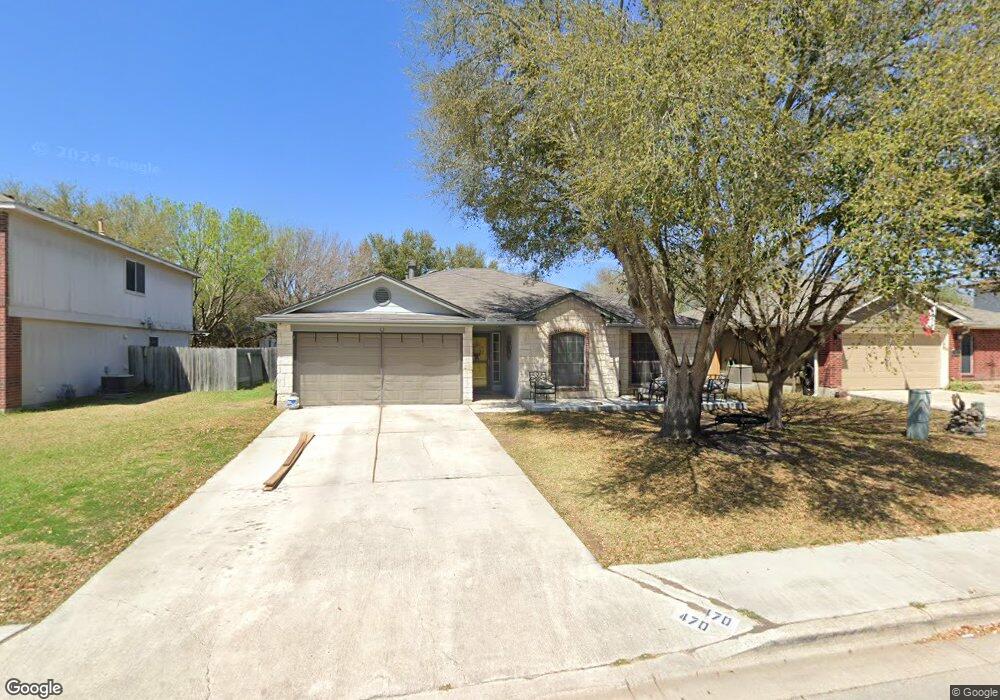
This home is located at 470 Britni Loop, Kyle, TX 78640 and is currently estimated at $284,138, approximately $192 per square foot. 470 Britni Loop is a home located in Hays County with nearby schools including Susie Fuentes Elementary School, Armando Chapa Middle School, and Lehman High School.
Ownership History
Date
Name
Owned For
Owner Type
Purchase Details
Closed on
Jul 25, 2017
Sold by
Bernard Andrea
Bought by
Bernard Christopher Michael
Current Estimated Value
Home Financials for this Owner
Home Financials are based on the most recent Mortgage that was taken out on this home.
Original Mortgage
$152,000
Outstanding Balance
$126,356
Interest Rate
3.91%
Mortgage Type
Stand Alone First
Estimated Equity
$157,782
Purchase Details
Closed on
Apr 13, 2011
Sold by
Watts Christopher L and Combs Watts Angelina C
Bought by
Bernard Chris and Bernard Andrea
Home Financials for this Owner
Home Financials are based on the most recent Mortgage that was taken out on this home.
Original Mortgage
$120,368
Interest Rate
4.92%
Mortgage Type
FHA
Purchase Details
Closed on
Dec 3, 1999
Sold by
City Wide Llc
Bought by
Bernard Chris and Bernard Andrea
Create a Home Valuation Report for This Property
The Home Valuation Report is an in-depth analysis detailing your home's value as well as a comparison with similar homes in the area
Home Values in the Area
Average Home Value in this Area
Purchase History
| Date | Buyer | Sale Price | Title Company |
|---|---|---|---|
| Bernard Christopher Michael | -- | None Available | |
| Bernard Chris | -- | Itc | |
| Bernard Chris | -- | -- |
Source: Public Records
Mortgage History
| Date | Status | Borrower | Loan Amount |
|---|---|---|---|
| Open | Bernard Christopher Michael | $152,000 | |
| Closed | Bernard Chris | $120,368 |
Source: Public Records
Tax History Compared to Growth
Tax History
| Year | Tax Paid | Tax Assessment Tax Assessment Total Assessment is a certain percentage of the fair market value that is determined by local assessors to be the total taxable value of land and additions on the property. | Land | Improvement |
|---|---|---|---|---|
| 2025 | $4,528 | $269,860 | $79,300 | $190,560 |
| 2024 | $4,528 | $261,328 | $79,300 | $216,630 |
| 2023 | $5,307 | $237,571 | $79,300 | $233,670 |
| 2022 | $5,256 | $215,974 | $70,200 | $231,660 |
| 2021 | $5,209 | $196,340 | $35,000 | $161,340 |
| 2020 | $4,505 | $184,050 | $28,000 | $156,050 |
| 2019 | $4,898 | $177,310 | $28,000 | $149,310 |
| 2018 | $4,604 | $166,210 | $17,700 | $148,510 |
| 2017 | $4,150 | $147,222 | $17,700 | $137,390 |
| 2016 | $3,773 | $133,838 | $16,500 | $121,810 |
| 2015 | $2,818 | $121,671 | $15,000 | $110,870 |
Source: Public Records
Map
Nearby Homes
- 180 Stephen Ct
- 221 Dashelle Run
- 801 Brandi Cir
- 741 Brandi Cir
- 3085 Winding Creek Rd
- 220 Backwater Rd
- 3073 Winding Creek Rd
- 210 Backwater Rd
- 3067 Winding Creek Rd
- 3059 Winding Creek Rd
- 3051 Winding Creek Rd
- 180 Backwater Rd
- 3043 Winding Creek Rd
- 3035 Winding Creek Rd
- 160 Backwater Rd
- 150 Backwater Rd
- 3013 Winding Creek Rd
- 141 Henke Cove
- 111 Hiver Cir
- 2971 Winding Creek Rd
- 460 Britni Loop
- 480 Britni Loop
- 450 Britni Loop
- 490 Britni Loop
- 461 Britni Loop
- 481 Britni Loop
- 1151 Brandi Cir
- 471 Britni Loop
- 1161 Brandi Cir
- 1165 Brandi Cir
- 440 Britni Loop
- 1141 Brandi Cir
- 500 Britni Loop
- 451 Britni Loop
- 1171 Brandi Cir
- 1131 Brandi Cir
- 491 Britni Loop
- 441 Britni Loop
- 430 Britni Loop
- 510 Britni Loop