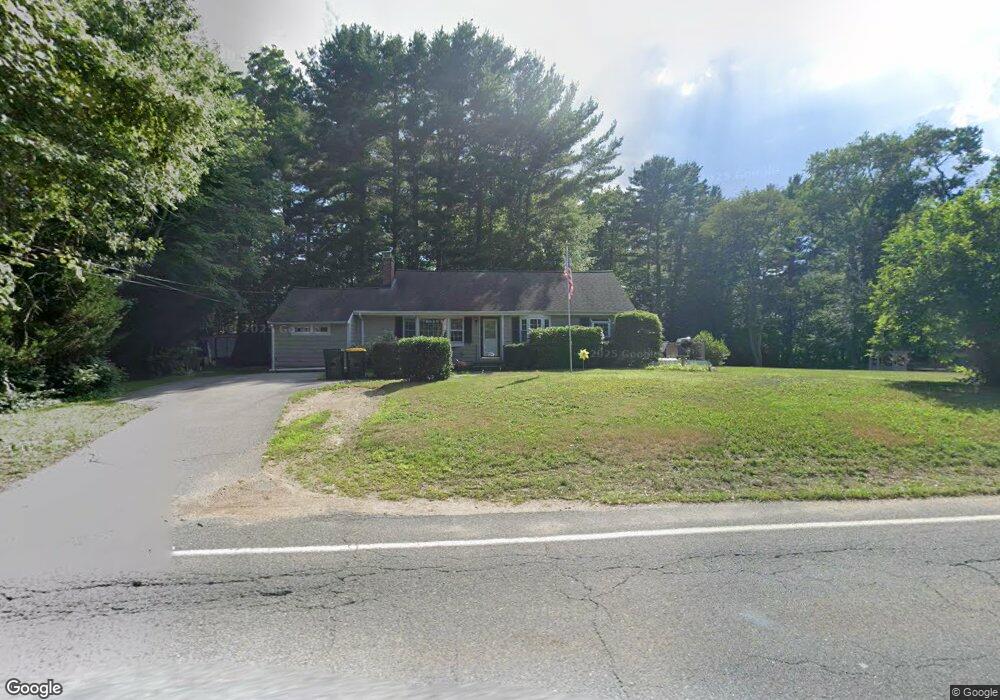
470 Brook St Hanson, MA 02341
Estimated Value: $472,251 - $593,000
3
Beds
1
Bath
1,129
Sq Ft
$486/Sq Ft
Est. Value
About This Home
This home is located at 470 Brook St, Hanson, MA 02341 and is currently estimated at $548,313, approximately $485 per square foot. 470 Brook St is a home located in Plymouth County with nearby schools including Cadence Academy Preschool - Hanover and Cardinal Cushing Centers.
Ownership History
Date
Name
Owned For
Owner Type
Purchase Details
Closed on
Jul 21, 2004
Sold by
Benedetti Deane R and Benedetti Wendy A
Bought by
Benedetti Deane R
Current Estimated Value
Home Financials for this Owner
Home Financials are based on the most recent Mortgage that was taken out on this home.
Original Mortgage
$262,000
Interest Rate
6.28%
Mortgage Type
Purchase Money Mortgage
Purchase Details
Closed on
Feb 25, 2000
Sold by
Orourke Francis T and Orourke Joanne
Bought by
Benedetti Deane R and Benedettis Wendy A
Create a Home Valuation Report for This Property
The Home Valuation Report is an in-depth analysis detailing your home's value as well as a comparison with similar homes in the area
Home Values in the Area
Average Home Value in this Area
Purchase History
| Date | Buyer | Sale Price | Title Company |
|---|---|---|---|
| Benedetti Deane R | $87,500 | -- | |
| Benedetti Deane R | $185,000 | -- |
Source: Public Records
Mortgage History
| Date | Status | Borrower | Loan Amount |
|---|---|---|---|
| Open | Benedetti Deane R | $310,000 | |
| Closed | Benedetti Deane R | $262,000 | |
| Previous Owner | Benedetti Deane R | $170,000 |
Source: Public Records
Tax History
| Year | Tax Paid | Tax Assessment Tax Assessment Total Assessment is a certain percentage of the fair market value that is determined by local assessors to be the total taxable value of land and additions on the property. | Land | Improvement |
|---|---|---|---|---|
| 2025 | $5,419 | $405,000 | $179,100 | $225,900 |
| 2024 | $5,262 | $393,300 | $173,900 | $219,400 |
| 2023 | $5,180 | $365,300 | $173,900 | $191,400 |
| 2022 | $5,011 | $332,100 | $158,100 | $174,000 |
| 2021 | $4,568 | $302,500 | $152,000 | $150,500 |
| 2020 | $4,463 | $292,300 | $146,800 | $145,500 |
| 2019 | $4,327 | $278,600 | $144,000 | $134,600 |
| 2018 | $3,940 | $248,900 | $138,500 | $110,400 |
| 2017 | $3,790 | $237,200 | $131,900 | $105,300 |
| 2016 | $3,851 | $232,700 | $131,900 | $100,800 |
| 2015 | $3,673 | $230,700 | $131,900 | $98,800 |
Source: Public Records
Map
Nearby Homes
- 339 State St
- 269 Lakeside Rd
- 127 Crescent Place
- 134 Crescent St
- 430 Brook Bend Rd
- 161 Winter St Unit 11
- 26 Stonebridge Dr
- 66 Wildwood Rd
- 139 Fairwood Dr
- 51 Farmside Dr
- 108 Waterford Dr
- 285 W Elm St
- 7 Farmside Dr
- Lot 6 Way
- 84 Liberty St
- 60 Summer Path Way
- 114 Graham Hill Dr
- Lot 5 Princeton Way
- 7 Andrew Dr
- 361 County Rd
Your Personal Tour Guide
Ask me questions while you tour the home.