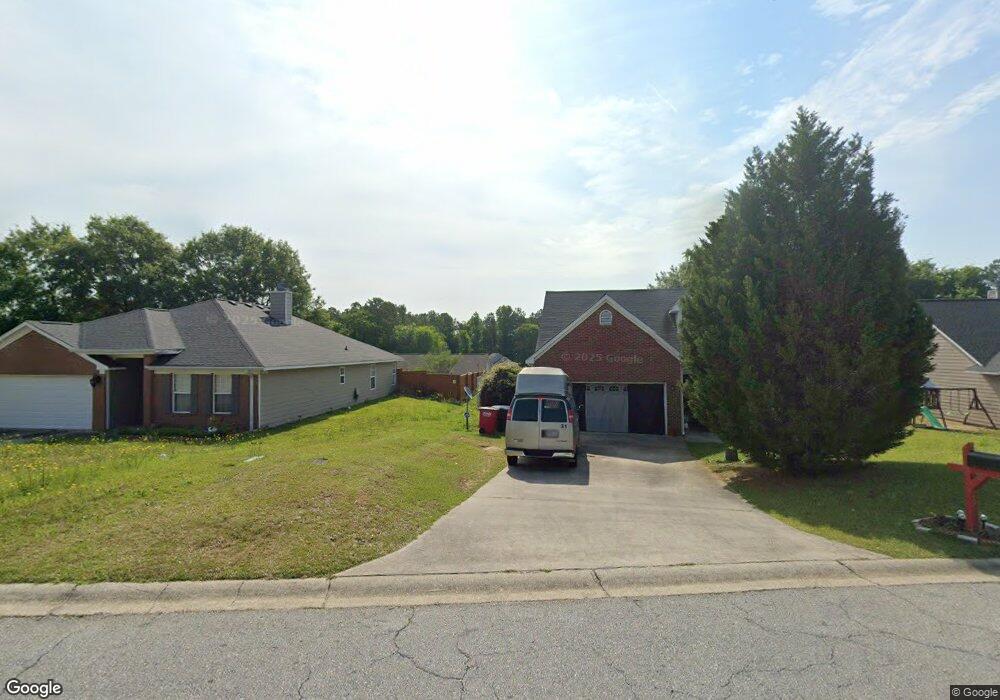
470 Crabapple Place Macon, GA 31217
Estimated Value: $147,000 - $171,040
3
Beds
2
Baths
1,422
Sq Ft
$113/Sq Ft
Est. Value
About This Home
This home is located at 470 Crabapple Place, Macon, GA 31217 and is currently estimated at $160,510, approximately $112 per square foot. 470 Crabapple Place is a home located in Bibb County with nearby schools including Bernd Elementary School, Appling Middle School, and Northeast High School.
Ownership History
Date
Name
Owned For
Owner Type
Purchase Details
Closed on
Feb 10, 2023
Sold by
Watson Clinton
Bought by
470 Crabapple Place Llc
Current Estimated Value
Purchase Details
Closed on
Jan 30, 2018
Sold by
Residential Asset Securities Corportatio
Bought by
Watson Clinton
Purchase Details
Closed on
Nov 29, 2017
Sold by
Bryant Annette S
Bought by
Us Bank National Association
Home Financials for this Owner
Home Financials are based on the most recent Mortgage that was taken out on this home.
Original Mortgage
$90,000
Interest Rate
3.94%
Purchase Details
Closed on
Oct 7, 2005
Sold by
Wolz Arthur L and Shrader Jennifer Lynne
Bought by
Bryant Annette S
Home Financials for this Owner
Home Financials are based on the most recent Mortgage that was taken out on this home.
Original Mortgage
$90,000
Interest Rate
8.55%
Mortgage Type
Adjustable Rate Mortgage/ARM
Purchase Details
Closed on
Mar 17, 2003
Purchase Details
Closed on
Nov 26, 2002
Create a Home Valuation Report for This Property
The Home Valuation Report is an in-depth analysis detailing your home's value as well as a comparison with similar homes in the area
Home Values in the Area
Average Home Value in this Area
Purchase History
| Date | Buyer | Sale Price | Title Company |
|---|---|---|---|
| 470 Crabapple Place Llc | -- | -- | |
| Watson Clinton | $60,075 | Brightling Title | |
| Us Bank National Association | $70,000 | None Available | |
| Bryant Annette S | $112,500 | None Available | |
| -- | $103,800 | -- | |
| -- | $15,500 | -- |
Source: Public Records
Mortgage History
| Date | Status | Borrower | Loan Amount |
|---|---|---|---|
| Previous Owner | Us Bank National Association | $90,000 | |
| Previous Owner | Bryant Annette S | $90,000 |
Source: Public Records
Tax History Compared to Growth
Tax History
| Year | Tax Paid | Tax Assessment Tax Assessment Total Assessment is a certain percentage of the fair market value that is determined by local assessors to be the total taxable value of land and additions on the property. | Land | Improvement |
|---|---|---|---|---|
| 2025 | $1,432 | $58,256 | $6,000 | $52,256 |
| 2024 | $1,480 | $58,256 | $6,000 | $52,256 |
| 2023 | $1,353 | $53,279 | $6,000 | $47,279 |
| 2022 | $1,616 | $46,674 | $7,820 | $38,854 |
| 2021 | $1,447 | $38,080 | $5,984 | $32,096 |
| 2020 | $1,605 | $41,337 | $5,440 | $35,897 |
| 2019 | $934 | $36,774 | $5,100 | $31,674 |
| 2018 | $2,018 | $30,652 | $5,100 | $25,552 |
| 2017 | $1,069 | $28,541 | $5,100 | $23,441 |
| 2016 | $987 | $28,541 | $5,100 | $23,441 |
| 2015 | $1,399 | $28,559 | $5,100 | $23,459 |
| 2014 | $1,401 | $28,559 | $5,100 | $23,459 |
Source: Public Records
Map
Nearby Homes
- 253 Apple Valley Rd
- 631 Crabapple Place
- 2975 Frederick Dr
- 5151 Riggins Mill Rd
- 2766 Stanley Dr
- 2776 Stanley Dr
- 3741 Franklinton Rd
- 4462 Riggins Mill Rd
- 5503 Jeffersonville Rd
- 5055 Riggins Mill Rd
- 4255 Training School Rd
- 4240 Training School Rd
- 3917 Jeffersonville Rd
- 3909 Jeffersonville Rd
- 1995 Crooms Dr
- 3335 Esther Dr
- 3320 Jones Dr
- 4231 Donnan Rd
- 474 Crabapple Place
- 462 Crabapple Place
- 478 Crabapple Place
- 174 Apple Valley Rd
- 178 Apple Valley Rd
- 170 Apple Valley Rd
- 182 Apple Valley Rd
- 458 Crabapple Place
- 458 Crabapple Place Unit 88
- 166 Apple Valley Rd
- 482 Crabapple Place
- 186 Apple Valley Rd
- 471 Crabapple Place
- 1 Apple Valley Rd
- 0 Apple Valley Rd Unit 7441821
- 0 Apple Valley Rd Unit 7511084
- 0 Apple Valley Rd Unit 7407559
- 0 Apple Valley Rd Unit 7195129
- 0 Apple Valley Rd
- 467 Crabapple Place