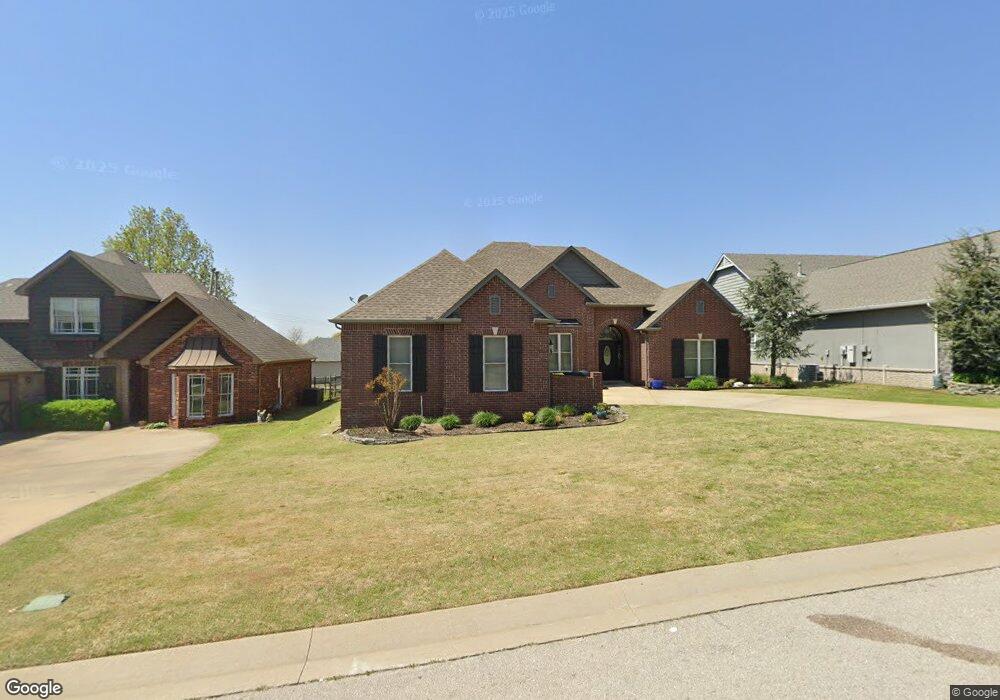
470 Cross Timbers Blvd Sapulpa, OK 74066
Estimated Value: $284,138 - $512,000
4
Beds
2
Baths
2,189
Sq Ft
$188/Sq Ft
Est. Value
About This Home
This home is located at 470 Cross Timbers Blvd, Sapulpa, OK 74066 and is currently estimated at $411,285, approximately $187 per square foot. 470 Cross Timbers Blvd is a home located in Creek County with nearby schools including Sapulpa Middle School, Sapulpa Junior High School, and Sapulpa High School.
Ownership History
Date
Name
Owned For
Owner Type
Purchase Details
Closed on
Nov 22, 2024
Sold by
Wachob Properties Llc
Bought by
Shipman Julie Dee Ann and Shipman Farrell Scott
Current Estimated Value
Home Financials for this Owner
Home Financials are based on the most recent Mortgage that was taken out on this home.
Original Mortgage
$95,250
Outstanding Balance
$90,375
Interest Rate
6.32%
Mortgage Type
Seller Take Back
Estimated Equity
$320,910
Purchase Details
Closed on
Jun 3, 2013
Sold by
Wachob Derek and Wachob Nora
Bought by
Wachob Properties Llc
Purchase Details
Closed on
Jan 15, 2013
Sold by
Freedom Homes Oklahoma Llc
Bought by
Wachob Derek and Wachob Nora
Purchase Details
Closed on
Aug 6, 2007
Sold by
Lakes At Cross Timbers Lc
Bought by
Freedom Homes Llc
Create a Home Valuation Report for This Property
The Home Valuation Report is an in-depth analysis detailing your home's value as well as a comparison with similar homes in the area
Home Values in the Area
Average Home Value in this Area
Purchase History
| Date | Buyer | Sale Price | Title Company |
|---|---|---|---|
| Shipman Julie Dee Ann | $219,000 | None Listed On Document | |
| Shipman Julie Dee Ann | $219,000 | None Listed On Document | |
| Wachob Properties Llc | -- | None Available | |
| Wachob Derek | $2,190,000 | None Available | |
| Freedom Homes Llc | $39,000 | None Available |
Source: Public Records
Mortgage History
| Date | Status | Borrower | Loan Amount |
|---|---|---|---|
| Open | Shipman Julie Dee Ann | $95,250 | |
| Closed | Shipman Julie Dee Ann | $95,250 |
Source: Public Records
Tax History Compared to Growth
Tax History
| Year | Tax Paid | Tax Assessment Tax Assessment Total Assessment is a certain percentage of the fair market value that is determined by local assessors to be the total taxable value of land and additions on the property. | Land | Improvement |
|---|---|---|---|---|
| 2025 | $4,403 | $41,232 | $7,200 | $34,032 |
| 2024 | $4,403 | $36,217 | $7,200 | $29,017 |
| 2023 | $4,403 | $34,493 | $7,200 | $27,293 |
| 2022 | $3,773 | $32,850 | $7,200 | $25,650 |
| 2021 | $3,712 | $31,286 | $7,200 | $24,086 |
| 2020 | $3,646 | $30,904 | $7,200 | $23,704 |
| 2019 | $3,489 | $29,433 | $7,200 | $22,233 |
| 2018 | $3,392 | $28,031 | $7,200 | $20,831 |
| 2017 | $3,374 | $28,031 | $7,200 | $20,831 |
| 2016 | $3,208 | $28,031 | $7,200 | $20,831 |
| 2015 | -- | $27,761 | $6,930 | $20,831 |
| 2014 | -- | $26,439 | $4,680 | $21,759 |
Source: Public Records
Map
Nearby Homes
- 461 Cross Timbers Blvd
- 421 Summercrest Ct
- 605 Cross Timbers Blvd
- 609 Cross Timbers Blvd
- 590 Creekside Dr
- 540 Creekside Dr
- 4367 Lakeside Dr
- 626 Countrywood Way
- 527 Pioneer Rd
- 11163 S 55th West Ave
- 0 Lakeside Dr
- 404 Hickory Hill Rd
- 504 Hickory Hill Rd
- 2810 E Hwy 117
- 5672 W Hilton Rd
- 11602 S 30th West Ave
- 5231 W Hilton Rd
- 3003 Laurel Oaks Rd
- 10732 S 33rd West Ave
- 2712 Raintree Cir
- 456 Cross Timbers Blvd
- 490 Cross Timbers Blvd
- 520 Cross Timbers Blvd
- 501 Cross Timbers Blvd
- 501 Cross Timbers Blvd
- 441 Cross Timbers Blvd
- 546 Cross Timbers Blvd
- 515 Cross Timbers Blvd
- 440 Cross Timbers Blvd
- 4704 Hunters Hill
- 4704 Hunters Hill
- 4820 Hunters Hill St
- 4820 Hunters Hill
- 531 Cross Timbers Blvd
- 568 Cross Timbers Blvd
- 551 Cross Timbers Blvd
- 4850 Hunters Hill
- 0 Hunters Hill
- 410 Summercrest Ct
- 571 Cross Timbers Blvd