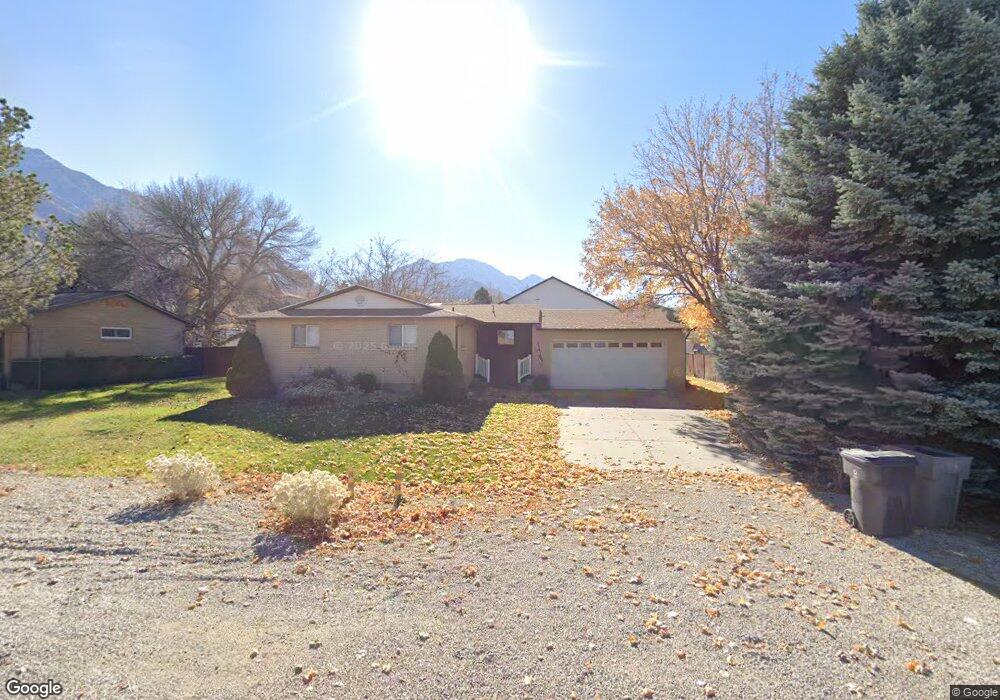
470 E 350 S Santaquin, UT 84655
Estimated Value: $463,000 - $484,354
5
Beds
2
Baths
2,620
Sq Ft
$181/Sq Ft
Est. Value
About This Home
This home is located at 470 E 350 S, Santaquin, UT 84655 and is currently estimated at $474,118, approximately $180 per square foot. 470 E 350 S is a home located in Utah County with nearby schools including Orchard Hills Elementary School, Payson Junior High School, and Mt. Nebo Middle.
Ownership History
Date
Name
Owned For
Owner Type
Purchase Details
Closed on
Jul 15, 2019
Sold by
Hpa Us1 Llc
Bought by
Hpa Ii Borrower 2019 1 Llc
Current Estimated Value
Home Financials for this Owner
Home Financials are based on the most recent Mortgage that was taken out on this home.
Original Mortgage
$292,423,143
Outstanding Balance
$255,712,150
Interest Rate
3.73%
Estimated Equity
-$255,238,032
Purchase Details
Closed on
May 30, 2019
Sold by
Gail Mccloud Trust
Bought by
Hpa Us1 Llc
Home Financials for this Owner
Home Financials are based on the most recent Mortgage that was taken out on this home.
Original Mortgage
$292,423,143
Outstanding Balance
$255,712,150
Interest Rate
3.73%
Estimated Equity
-$255,238,032
Purchase Details
Closed on
Jul 26, 2001
Sold by
Mccloud Gail J and Mccloud Thomas W
Bought by
Mccloud Gail J
Purchase Details
Closed on
May 22, 2000
Sold by
Mccloud Gail J
Bought by
Mccloud Gail J and Mccloud Thomas W
Create a Home Valuation Report for This Property
The Home Valuation Report is an in-depth analysis detailing your home's value as well as a comparison with similar homes in the area
Home Values in the Area
Average Home Value in this Area
Purchase History
| Date | Buyer | Sale Price | Title Company |
|---|---|---|---|
| Hpa Ii Borrower 2019 1 Llc | -- | Stewart Title Ins Agcy Of Ut | |
| Hpa Us1 Llc | -- | Stewart Title Ins Agcy Of Ut | |
| Mccloud Gail J | -- | Provo Land Title Company | |
| Mccloud Gail J | -- | Provo Land Title Company |
Source: Public Records
Mortgage History
| Date | Status | Borrower | Loan Amount |
|---|---|---|---|
| Open | Hpa Ii Borrower 2019 1 Llc | $292,423,143 |
Source: Public Records
Tax History
| Year | Tax Paid | Tax Assessment Tax Assessment Total Assessment is a certain percentage of the fair market value that is determined by local assessors to be the total taxable value of land and additions on the property. | Land | Improvement |
|---|---|---|---|---|
| 2025 | $2,274 | $245,135 | -- | -- |
| 2024 | $2,274 | $226,435 | $0 | $0 |
| 2023 | $2,362 | $236,005 | $0 | $0 |
| 2022 | $2,246 | $231,440 | $0 | $0 |
| 2021 | $1,930 | $308,200 | $76,900 | $231,300 |
| 2020 | $1,848 | $286,100 | $66,900 | $219,200 |
| 2019 | $1,665 | $263,500 | $63,200 | $200,300 |
| 2018 | $322 | $233,700 | $59,500 | $174,200 |
| 2017 | $299 | $118,470 | $0 | $0 |
| 2016 | $360 | $110,275 | $0 | $0 |
| 2015 | $308 | $98,285 | $0 | $0 |
| 2014 | $323 | $92,455 | $0 | $0 |
Source: Public Records
Map
Nearby Homes
Your Personal Tour Guide
Ask me questions while you tour the home.