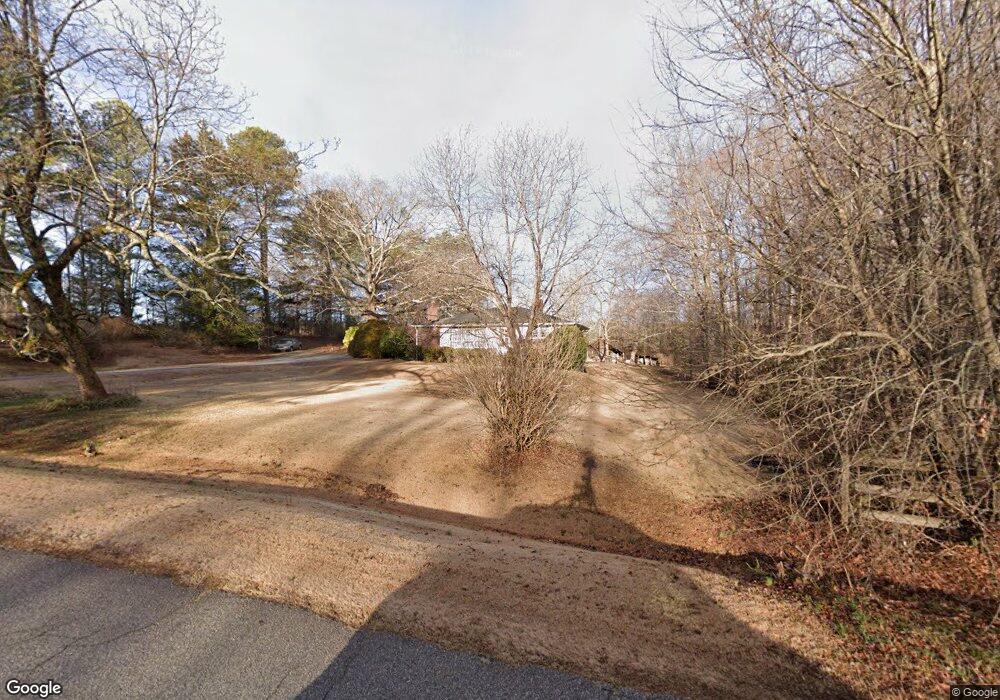
470 Honeysuckle Rd Campobello, SC 29322
Estimated Value: $241,000 - $271,880
3
Beds
1
Bath
1,386
Sq Ft
$181/Sq Ft
Est. Value
About This Home
This home is located at 470 Honeysuckle Rd, Campobello, SC 29322 and is currently estimated at $250,970, approximately $181 per square foot. 470 Honeysuckle Rd is a home located in Spartanburg County with nearby schools including Holly Springs-Motlow Elementary School, T.E. Mabry Middle School, and Chapman High School.
Ownership History
Date
Name
Owned For
Owner Type
Purchase Details
Closed on
Oct 10, 2025
Sold by
Hightower Chad L and Hightower Anna D
Bought by
Aho Treyton Arvi
Current Estimated Value
Purchase Details
Closed on
May 30, 2024
Sold by
Clayton Kathy Hightower and Hightower James Otis
Bought by
Hightower Chad L and Hightower Anna D
Home Financials for this Owner
Home Financials are based on the most recent Mortgage that was taken out on this home.
Original Mortgage
$185,250
Outstanding Balance
$182,266
Interest Rate
7.1%
Mortgage Type
New Conventional
Estimated Equity
$68,704
Purchase Details
Closed on
Dec 19, 2023
Sold by
Hightower Bernice L
Bought by
Hightower James Otis and Clayton Mary Kathy
Purchase Details
Closed on
Jan 8, 2018
Sold by
Dockery Heather Louise
Bought by
Vanderbilt Mortgage Finance Inc
Purchase Details
Closed on
Jan 13, 2010
Sold by
Estate Of John Hightower
Bought by
Hightower Bernice L
Create a Home Valuation Report for This Property
The Home Valuation Report is an in-depth analysis detailing your home's value as well as a comparison with similar homes in the area
Home Values in the Area
Average Home Value in this Area
Purchase History
| Date | Buyer | Sale Price | Title Company |
|---|---|---|---|
| Aho Treyton Arvi | $240,000 | -- | |
| Hightower Chad L | $195,000 | None Listed On Document | |
| Hightower James Otis | -- | None Listed On Document | |
| Vanderbilt Mortgage Finance Inc | $40,000 | None Available | |
| Hightower Bernice L | -- | -- |
Source: Public Records
Mortgage History
| Date | Status | Borrower | Loan Amount |
|---|---|---|---|
| Open | Hightower Chad L | $185,250 |
Source: Public Records
Tax History
| Year | Tax Paid | Tax Assessment Tax Assessment Total Assessment is a certain percentage of the fair market value that is determined by local assessors to be the total taxable value of land and additions on the property. | Land | Improvement |
|---|---|---|---|---|
| 2025 | $2,754 | $11,700 | $3,180 | $8,520 |
| 2024 | $2,754 | $6,642 | $2,562 | $4,080 |
| 2023 | $2,754 | $3,708 | $1,430 | $2,278 |
| 2022 | $295 | $3,225 | $1,211 | $2,014 |
| 2021 | $292 | $3,225 | $1,211 | $2,014 |
| 2020 | $284 | $3,225 | $1,211 | $2,014 |
| 2019 | $283 | $3,225 | $1,211 | $2,014 |
| 2018 | $280 | $3,225 | $1,211 | $2,014 |
| 2017 | $203 | $2,804 | $1,102 | $1,702 |
| 2016 | $203 | $2,804 | $1,102 | $1,702 |
| 2015 | $198 | $2,804 | $1,102 | $1,702 |
| 2014 | $192 | $2,804 | $1,102 | $1,702 |
Source: Public Records
Map
Nearby Homes
- 103 Cheyenne Ridge Trail
- 225 Cannon Ball Run
- 583 Adventure Isla Way
- 567 Adventure Isla Way
- 1002 Goodjoin Rd
- 1321 Wellton Place
- 592 Adventure Isla Way
- 584 Adventure Isla Way
- 587 Adventure Isla Way
- 424 Fowler Rd
- 420 Fowler Rd
- 604 Adventure Isla Way
- 580 Adventure Isla Way
- 572 Adventure Isla Way
- 1016 Alder Pond Dr
- 1520 Spencer Creek Rd
- Bradley Dill Rd
- 1325 Wellton Place
- PENNINGTON Plan at Alder Pond
- PENNINGTON B Plan at Alder Pond
- 428 Honeysuckle Rd
- 1780 Mount Lebanon Rd
- 430 Honeysuckle Rd
- 1850 Mount Lebanon Rd
- 860 Motlow School Rd
- 830 Motlow School Rd
- 390 Honeysuckle Rd
- 820 Motlow School Rd
- 1890 Mount Lebanon Rd
- 1640 Mount Lebanon Rd
- 910 Motlow School Rd
- 835 Motlow School Rd
- 385 Honeysuckle Rd
- 815 Motlow School Rd
- 855 Motlow School Rd
- 1904 Mt Lebanon
- 1904 Mount Lebanon Rd
- 1590 Mount Lebanon Rd
- 950 Motlow School Rd
- 00 Mount Lebanon Rd
Your Personal Tour Guide
Ask me questions while you tour the home.