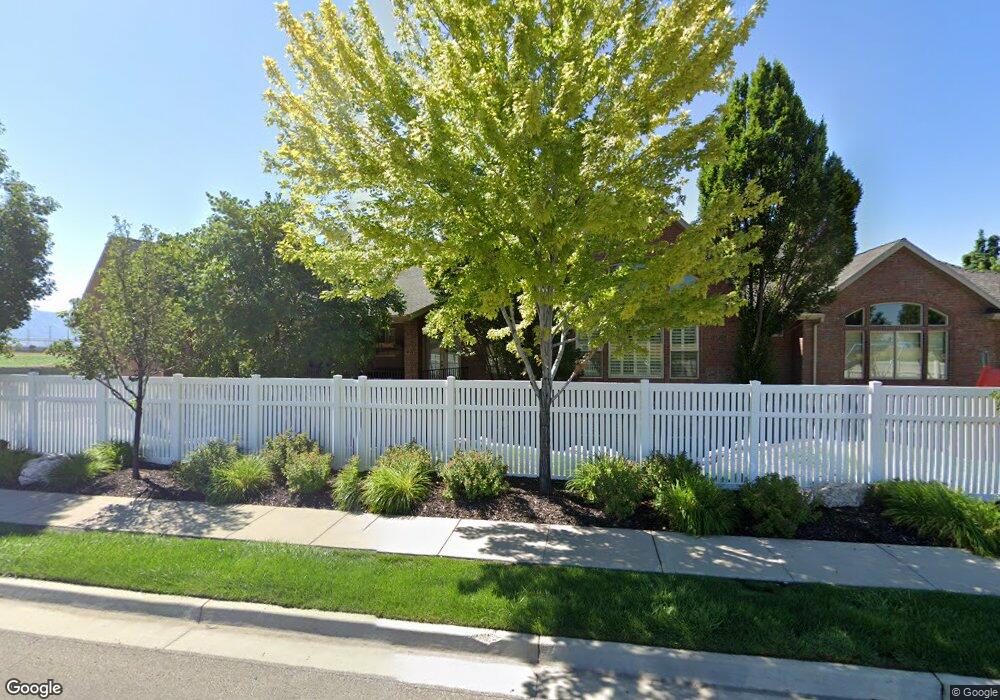
470 N 2975 W Layton, UT 84041
Estimated Value: $898,000 - $1,125,342
3
Beds
3
Baths
2,867
Sq Ft
$351/Sq Ft
Est. Value
About This Home
This home is located at 470 N 2975 W, Layton, UT 84041 and is currently estimated at $1,005,586, approximately $350 per square foot. 470 N 2975 W is a home located in Davis County with nearby schools including Sand Springs Elementary School, Legacy Junior High School, and Layton High School.
Ownership History
Date
Name
Owned For
Owner Type
Purchase Details
Closed on
Jan 6, 2005
Sold by
Big Boy Investments Inc
Bought by
Robbins Brian J and Robbins Julie M
Current Estimated Value
Purchase Details
Closed on
Jan 3, 2005
Sold by
Mountain Green Development Llc
Bought by
Big Boy Investments Inc
Create a Home Valuation Report for This Property
The Home Valuation Report is an in-depth analysis detailing your home's value as well as a comparison with similar homes in the area
Home Values in the Area
Average Home Value in this Area
Purchase History
| Date | Buyer | Sale Price | Title Company |
|---|---|---|---|
| Robbins Brian J | -- | None Available | |
| Big Boy Investments Inc | -- | None Available |
Source: Public Records
Tax History Compared to Growth
Tax History
| Year | Tax Paid | Tax Assessment Tax Assessment Total Assessment is a certain percentage of the fair market value that is determined by local assessors to be the total taxable value of land and additions on the property. | Land | Improvement |
|---|---|---|---|---|
| 2025 | $5,418 | $568,700 | $171,392 | $397,308 |
| 2024 | $5,586 | $590,700 | $176,330 | $414,370 |
| 2023 | $5,086 | $948,000 | $202,042 | $745,958 |
| 2022 | $4,950 | $501,050 | $107,864 | $393,186 |
| 2021 | $4,366 | $659,000 | $161,700 | $497,300 |
| 2020 | $4,040 | $585,000 | $140,793 | $444,207 |
| 2019 | $3,941 | $559,000 | $132,780 | $426,220 |
| 2018 | $3,561 | $507,000 | $117,710 | $389,290 |
| 2016 | $3,511 | $257,895 | $52,363 | $205,532 |
| 2015 | $3,615 | $252,065 | $52,363 | $199,702 |
| 2014 | $3,076 | $219,343 | $52,363 | $166,980 |
| 2013 | -- | $206,168 | $46,068 | $160,100 |
Source: Public Records
Map
Nearby Homes