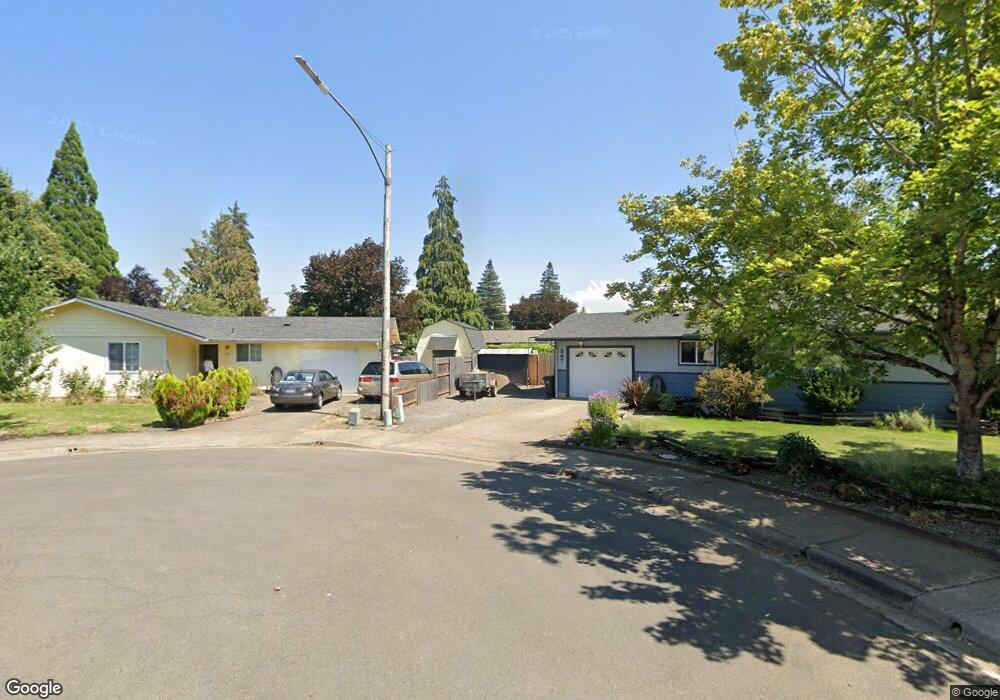
470 N 35th Ct Springfield, OR 97478
East Springfield NeighborhoodEstimated Value: $368,000 - $497,737
4
Beds
2
Baths
1,820
Sq Ft
$248/Sq Ft
Est. Value
About This Home
This home is located at 470 N 35th Ct, Springfield, OR 97478 and is currently estimated at $450,684, approximately $247 per square foot. 470 N 35th Ct is a home located in Lane County with nearby schools including Riverbend Elementary School, Briggs Middle School, and Thurston High School.
Ownership History
Date
Name
Owned For
Owner Type
Purchase Details
Closed on
Oct 18, 2024
Sold by
Kenton Aaron Kathrine
Bought by
Kenton Aaron and Bruvold Thomas Kenworth
Current Estimated Value
Purchase Details
Closed on
Nov 8, 2012
Sold by
Kenton Aaron and Bruvold Thomas K
Bought by
Kenton Aaron
Home Financials for this Owner
Home Financials are based on the most recent Mortgage that was taken out on this home.
Original Mortgage
$52,500
Interest Rate
3.36%
Mortgage Type
New Conventional
Purchase Details
Closed on
Dec 13, 2005
Sold by
Missakian Cynthia
Bought by
Nelson Larry E and Nelson Memory J
Home Financials for this Owner
Home Financials are based on the most recent Mortgage that was taken out on this home.
Original Mortgage
$217,579
Interest Rate
6.32%
Mortgage Type
VA
Create a Home Valuation Report for This Property
The Home Valuation Report is an in-depth analysis detailing your home's value as well as a comparison with similar homes in the area
Home Values in the Area
Average Home Value in this Area
Purchase History
| Date | Buyer | Sale Price | Title Company |
|---|---|---|---|
| Kenton Aaron | -- | Evergreen Land Title | |
| Kenton Aaron | -- | Accommodation | |
| Nelson Larry E | $213,000 | First American Title |
Source: Public Records
Mortgage History
| Date | Status | Borrower | Loan Amount |
|---|---|---|---|
| Previous Owner | Kenton Aaron | $52,500 | |
| Previous Owner | Nelson Larry E | $217,579 |
Source: Public Records
Tax History Compared to Growth
Tax History
| Year | Tax Paid | Tax Assessment Tax Assessment Total Assessment is a certain percentage of the fair market value that is determined by local assessors to be the total taxable value of land and additions on the property. | Land | Improvement |
|---|---|---|---|---|
| 2025 | $4,337 | $236,506 | -- | -- |
| 2024 | $4,267 | $229,618 | -- | -- |
| 2023 | $4,267 | $222,931 | $0 | $0 |
| 2022 | $3,952 | $216,438 | $0 | $0 |
| 2021 | $3,881 | $210,134 | $0 | $0 |
| 2020 | $3,767 | $204,014 | $0 | $0 |
| 2019 | $3,654 | $198,072 | $0 | $0 |
| 2018 | $3,445 | $171,258 | $0 | $0 |
| 2017 | $2,945 | $171,258 | $0 | $0 |
| 2016 | $2,580 | $148,739 | $0 | $0 |
| 2015 | $2,326 | $135,206 | $0 | $0 |
| 2014 | $2,327 | $133,368 | $0 | $0 |
Source: Public Records
Map
Nearby Homes