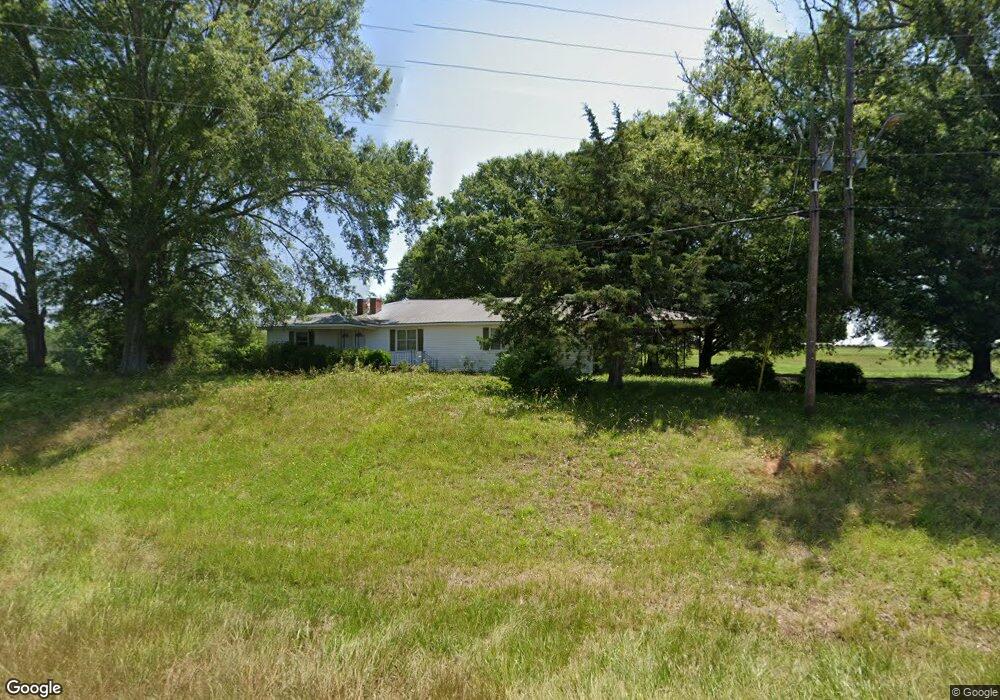
470 N Hulin Ave Tignall, GA 30668
Estimated Value: $259,000 - $574,000
3
Beds
2
Baths
2,270
Sq Ft
$181/Sq Ft
Est. Value
About This Home
This home is located at 470 N Hulin Ave, Tignall, GA 30668 and is currently estimated at $410,460, approximately $180 per square foot. 470 N Hulin Ave is a home located in Wilkes County with nearby schools including Washington-Wilkes Elementary School, Washington-Wilkes Primary School, and Washington-Wilkes Middle School.
Ownership History
Date
Name
Owned For
Owner Type
Purchase Details
Closed on
Apr 10, 2019
Sold by
Harrison Jimmy Roy
Bought by
Harrison Michael D
Current Estimated Value
Purchase Details
Closed on
Dec 31, 2001
Sold by
Harrison Mary Ellen
Bought by
Harrison Michael D
Purchase Details
Closed on
Jan 1, 1977
Bought by
Harrison Mary Ellen
Create a Home Valuation Report for This Property
The Home Valuation Report is an in-depth analysis detailing your home's value as well as a comparison with similar homes in the area
Home Values in the Area
Average Home Value in this Area
Purchase History
| Date | Buyer | Sale Price | Title Company |
|---|---|---|---|
| Harrison Michael D | -- | -- | |
| Harrison Michael D | -- | -- | |
| Harrison Mary Ellen | -- | -- |
Source: Public Records
Tax History Compared to Growth
Tax History
| Year | Tax Paid | Tax Assessment Tax Assessment Total Assessment is a certain percentage of the fair market value that is determined by local assessors to be the total taxable value of land and additions on the property. | Land | Improvement |
|---|---|---|---|---|
| 2025 | $2,362 | $54,404 | $18,711 | $35,693 |
| 2024 | $2,390 | $54,404 | $18,711 | $35,693 |
| 2023 | $2,155 | $54,404 | $18,711 | $35,693 |
| 2022 | $1,575 | $54,404 | $18,711 | $35,693 |
| 2021 | $1,172 | $54,404 | $18,711 | $35,693 |
| 2020 | $1,186 | $54,404 | $18,711 | $35,693 |
| 2019 | $1,193 | $54,404 | $18,711 | $35,693 |
| 2018 | $2,181 | $54,404 | $18,711 | $35,693 |
| 2017 | $2,181 | $54,404 | $18,711 | $35,693 |
| 2016 | $1,155 | $54,375 | $18,711 | $35,664 |
| 2015 | -- | $18,711 | $18,711 | $35,664 |
| 2014 | -- | $54,375 | $18,711 | $35,664 |
| 2013 | -- | $55,619 | $18,711 | $36,908 |
Source: Public Records
Map
Nearby Homes
- 6556 Elberton Rd
- 1046 Eagles Nest Trail
- 420 W Wooten St
- 525 S Hulin Ave
- 819 Jane Hill Rd
- 3 Bunch Rd
- 1 Bunch Rd
- 2 Bunch Rd
- 4 Bunch Rd
- 191 Bunch Rd
- 0 Oscar Walton Rd Unit 24714036
- 2132 Henry Hill Rd
- 2221 Sandtown Rd
- 0 Pete Johnson Rd Unit 24300768
- 0 Pete Johnson Rd Unit 24300767
- Lot D Newtown Rd
- Lot C Newtown Rd
- Lot B Newtown Rd
- Lot E Newtown Rd
- 7063 Danburg Rd
- 180 Delhi Rd
- 144 Delhi Rd
- 968 Delhi Rd
- 00 Delhi Rd
- 469 N Hulin Ave
- 543 N Hulin Ave
- 151 Stribling St
- 250 Delhi Rd
- 271 Delhi Rd
- 588 N Hulin Ave
- 0 Elberton Rd Unit CM906623
- 0 Elberton Rd Unit 10392001
- 0 Elberton Rd Unit 20088431
- 0 Elberton Rd Unit 20060312
- 7285 Elberton Rd
- 604 N Hulin Ave
- 604 N Hulin Ave
- 373 N Hulin Ave
- 328 N Hulin Ave
- 294 Delhi Rd