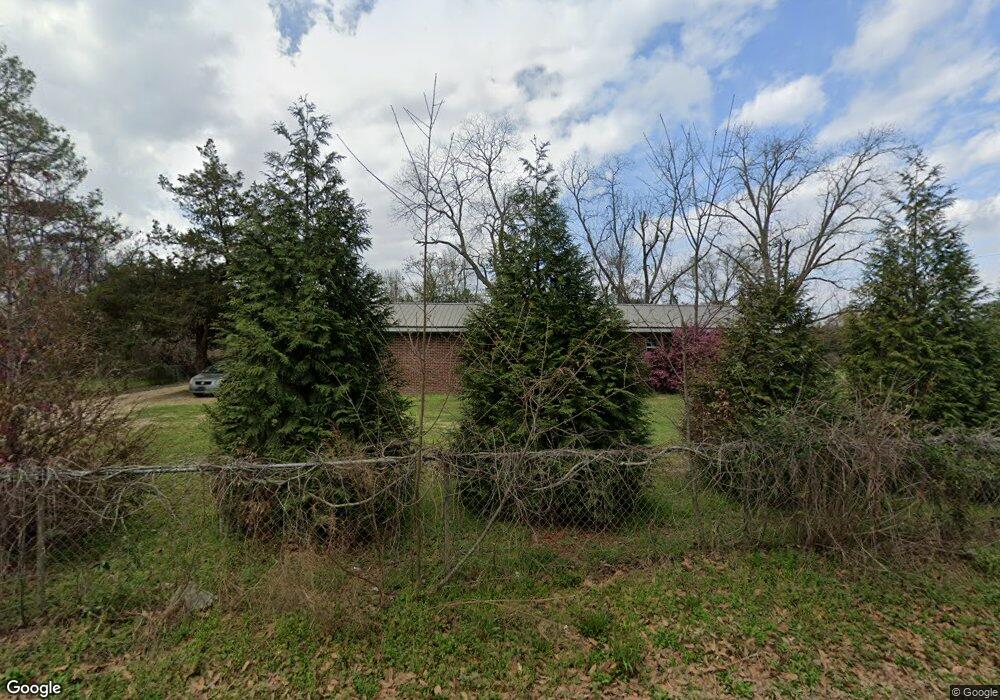
470 Nappa Rd Cordele, GA 31015
Estimated Value: $94,165 - $176,000
2
Beds
1
Bath
1,098
Sq Ft
$122/Sq Ft
Est. Value
About This Home
This home is located at 470 Nappa Rd, Cordele, GA 31015 and is currently estimated at $134,041, approximately $122 per square foot. 470 Nappa Rd is a home located in Crisp County with nearby schools including Crisp County Elementary School, Crisp County Primary School, and Crisp County Middle School.
Ownership History
Date
Name
Owned For
Owner Type
Purchase Details
Closed on
Sep 16, 2024
Sold by
Ergle Howard P
Bought by
Ergle Richard
Current Estimated Value
Purchase Details
Closed on
Dec 27, 2013
Sold by
Martin Waller Debbie Hall
Bought by
Ergle Howard P
Home Financials for this Owner
Home Financials are based on the most recent Mortgage that was taken out on this home.
Original Mortgage
$26,158
Interest Rate
4.29%
Mortgage Type
New Conventional
Purchase Details
Closed on
Jul 24, 2006
Sold by
Martin Debbie Hall
Bought by
Hughes Joseph M
Purchase Details
Closed on
Mar 10, 2006
Sold by
Hall Clara S
Bought by
Martin Debbie Hall
Purchase Details
Closed on
Oct 5, 1989
Bought by
Hall Kyle
Create a Home Valuation Report for This Property
The Home Valuation Report is an in-depth analysis detailing your home's value as well as a comparison with similar homes in the area
Home Values in the Area
Average Home Value in this Area
Purchase History
| Date | Buyer | Sale Price | Title Company |
|---|---|---|---|
| Ergle Richard | -- | -- | |
| Ergle Howard P | $30,000 | -- | |
| Hughes Joseph M | -- | -- | |
| Ergle Howard P | -- | -- | |
| Martin Debbie Hall | -- | -- | |
| Hall Clara S | -- | -- | |
| Hall Kyle | -- | -- |
Source: Public Records
Mortgage History
| Date | Status | Borrower | Loan Amount |
|---|---|---|---|
| Previous Owner | Ergle Howard P | $26,158 |
Source: Public Records
Tax History Compared to Growth
Tax History
| Year | Tax Paid | Tax Assessment Tax Assessment Total Assessment is a certain percentage of the fair market value that is determined by local assessors to be the total taxable value of land and additions on the property. | Land | Improvement |
|---|---|---|---|---|
| 2025 | $807 | $33,166 | $1,618 | $31,548 |
| 2024 | $807 | $29,808 | $1,498 | $28,310 |
| 2023 | $793 | $28,240 | $1,498 | $26,742 |
| 2022 | $739 | $26,323 | $1,199 | $25,124 |
| 2021 | $733 | $24,704 | $1,199 | $23,505 |
| 2020 | $734 | $24,704 | $1,199 | $23,505 |
| 2019 | $729 | $24,704 | $1,199 | $23,505 |
| 2018 | $476 | $15,528 | $1,743 | $13,785 |
| 2017 | $478 | $15,528 | $1,743 | $13,785 |
| 2016 | $477 | $15,528 | $1,743 | $13,785 |
| 2015 | -- | $15,528 | $1,743 | $13,785 |
| 2014 | -- | $15,528 | $1,743 | $13,785 |
| 2013 | -- | $15,528 | $1,743 | $13,784 |
Source: Public Records
Map
Nearby Homes
- 293 Wildwood Dr
- 1643 Ga Highway 257
- 1607 Georgia 257
- 127 Hill Rd
- 0 Old Nesbitt Rd
- 160 Old Nesbitt Rd
- 000 Brady Rd
- 00 Griffin Rd
- 703 N Pecan St
- 1009 E Tulip Ave
- 1015 E 8th Ave
- TBD S Greer St
- 0 S Greer St
- 705 Starr Place
- 1403 Georgia 90
- 405 N Bay St
- 603 E 1st Ave
- TBD N Pecan St
- 1509 E 20th Ave
- 413 E 2nd Ave
- 471 Nappa Rd
- 697 Twin Pines Rd
- 467 Nappa Rd
- 456 Nappa Rd
- 428 Nappa Rd
- 673 Twin Pines Rd
- 509 Nappa Rd
- 1323 Tremont Rd
- 1307 Tremont Rd
- 1366 Tremont Rd
- 1303 Tremont Rd
- 1308 Tremont Rd
- 1397 Tremont Rd
- 628 Twin Pines Rd
- 629 Twin Pines Rd
- 1267 Tremont Rd
- 1400 Tremont Rd
- 625 Twin Pines Rd
- 619 Twin Pines Rd
- 1283 Tremont Rd