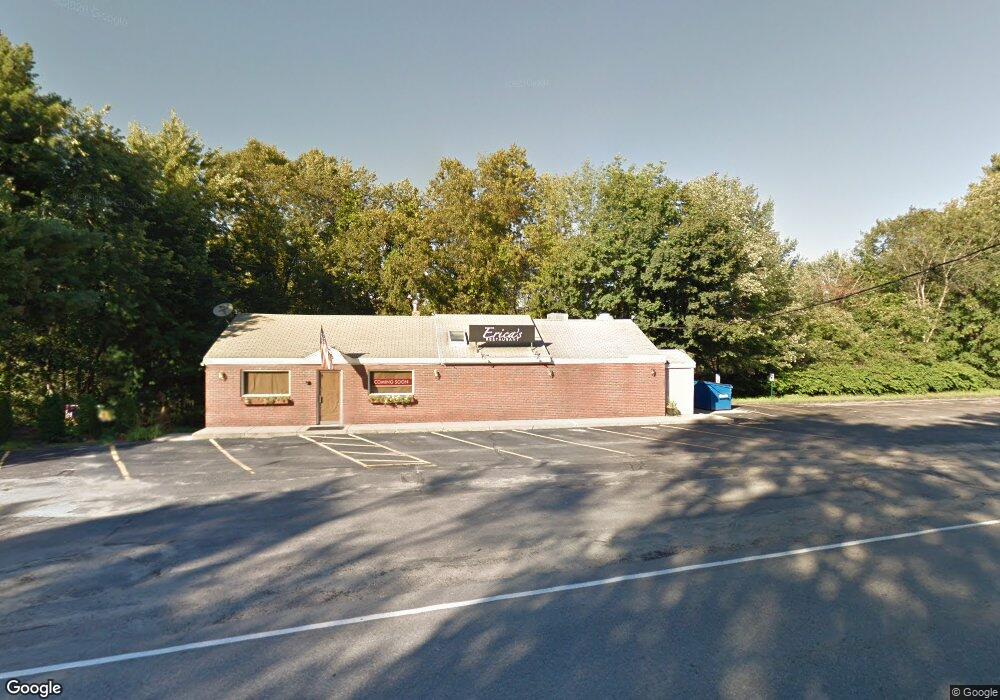
470 North Rd Unit 1 Sudbury, MA 01776
Estimated Value: $784,646
2
Beds
1
Bath
500
Sq Ft
$1,569/Sq Ft
Est. Value
About This Home
This home is located at 470 North Rd Unit 1, Sudbury, MA 01776 and is currently estimated at $784,646, approximately $1,569 per square foot. 470 North Rd Unit 1 is a home located in Middlesex County with nearby schools including Josiah Haynes Elementary School, Ephraim Curtis Middle School, and Lincoln-Sudbury Regional High School.
Ownership History
Date
Name
Owned For
Owner Type
Purchase Details
Closed on
May 18, 2018
Sold by
G & D Rt
Bought by
Macky Brown Enterprise
Current Estimated Value
Home Financials for this Owner
Home Financials are based on the most recent Mortgage that was taken out on this home.
Original Mortgage
$304,525
Outstanding Balance
$262,206
Interest Rate
4.4%
Mortgage Type
New Conventional
Estimated Equity
$522,440
Purchase Details
Closed on
Sep 9, 2016
Sold by
Cannarozzi Samuel J and G & D Rt
Bought by
Snow
Purchase Details
Closed on
Nov 1, 2004
Sold by
North Road Rt and Limone
Bought by
Limone Rosario
Purchase Details
Closed on
Apr 25, 1991
Sold by
117 House Rt
Bought by
Cannarozzi Samuel J
Create a Home Valuation Report for This Property
The Home Valuation Report is an in-depth analysis detailing your home's value as well as a comparison with similar homes in the area
Home Values in the Area
Average Home Value in this Area
Purchase History
| Date | Buyer | Sale Price | Title Company |
|---|---|---|---|
| Macky Brown Enterprise | $468,500 | -- | |
| Snow | $750,000 | -- | |
| G & D Rt | $750,000 | -- | |
| Limone Rosario | -- | -- | |
| Limone Rosario | -- | -- | |
| Cannarozzi Samuel J | $516,451 | -- | |
| Cannarozzi Samuel J | $516,451 | -- |
Source: Public Records
Mortgage History
| Date | Status | Borrower | Loan Amount |
|---|---|---|---|
| Open | Macky Brown Enterprise | $304,525 | |
| Closed | Cannarozzi Samuel J | $304,525 | |
| Previous Owner | Cannarozzi Samuel J | $175,000 |
Source: Public Records
Tax History Compared to Growth
Tax History
| Year | Tax Paid | Tax Assessment Tax Assessment Total Assessment is a certain percentage of the fair market value that is determined by local assessors to be the total taxable value of land and additions on the property. | Land | Improvement |
|---|---|---|---|---|
| 2025 | $12,999 | $617,800 | $298,200 | $319,600 |
| 2024 | $11,350 | $536,400 | $299,600 | $236,800 |
| 2023 | $10,696 | $528,700 | $299,600 | $229,100 |
| 2022 | $13,128 | $534,300 | $299,600 | $234,700 |
| 2021 | $13,008 | $509,100 | $299,600 | $209,500 |
| 2020 | $11,509 | $460,900 | $299,600 | $161,300 |
| 2019 | $12,335 | $507,600 | $299,600 | $208,000 |
| 2018 | $11,844 | $487,400 | $285,300 | $202,100 |
| 2017 | $11,865 | $474,400 | $278,200 | $196,200 |
| 2016 | $11,498 | $457,900 | $267,500 | $190,400 |
| 2015 | $10,305 | $414,200 | $249,600 | $164,600 |
| 2014 | $10,330 | $414,200 | $249,600 | $164,600 |
Source: Public Records
Map
Nearby Homes
- 67 Powder Mill Rd
- 57 Longfellow Rd
- 16 Blacksmith Dr
- 589 North Rd
- 369 Border Rd
- 5 Oak Ridge Dr Unit 7
- 42 Dakin Rd
- 10 Oak Ridge Dr Unit 5
- 29 Black Birch Ln Unit 29
- 9 Black Birch Ln Unit 9
- 5 Taintor Dr
- 96 Forest Ridge Rd Unit 96
- 250 Great Rd
- 5 Hayes St Unit 5
- 15 Arthur St Unit 15
- 13 Arthur St Unit 15
- 22 Garfield Ave
- 28 Waltham St Unit B
- 69 Powder Mill Rd
- 2 & 6 Powder Mill Rd