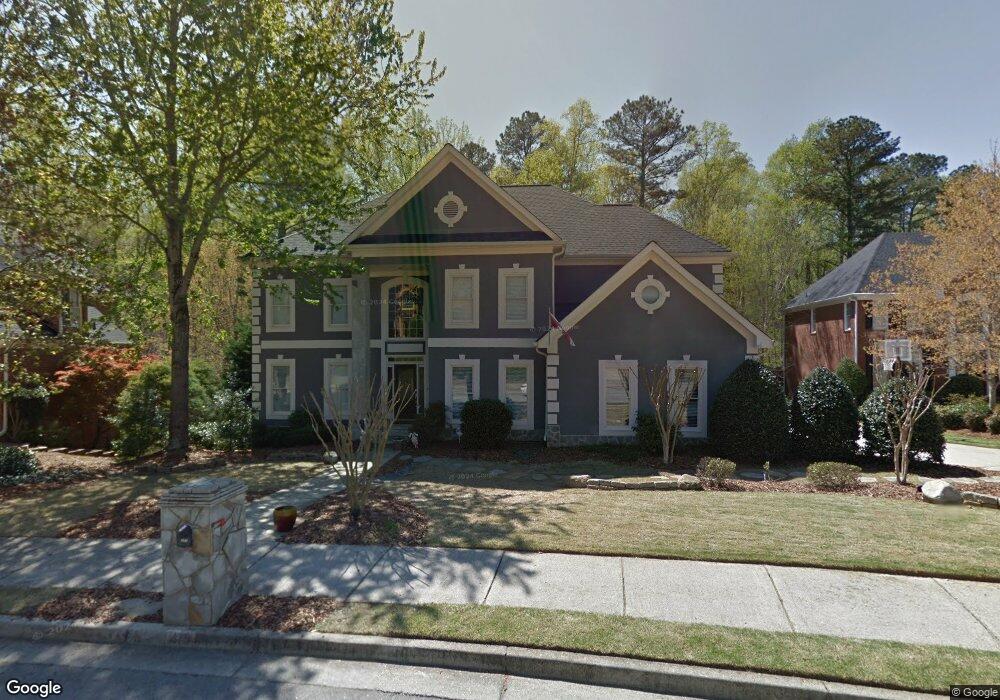
470 Park Creek Way Unit 2 Alpharetta, GA 30022
Estimated Value: $1,094,172 - $1,297,000
6
Beds
6
Baths
3,902
Sq Ft
$305/Sq Ft
Est. Value
About This Home
This home is located at 470 Park Creek Way Unit 2, Alpharetta, GA 30022 and is currently estimated at $1,189,293, approximately $304 per square foot. 470 Park Creek Way Unit 2 is a home located in Fulton County with nearby schools including Ocee Elementary School, Webb Bridge Middle School, and Alpharetta High School.
Ownership History
Date
Name
Owned For
Owner Type
Purchase Details
Closed on
Nov 18, 2011
Sold by
Hessler Colleen K
Bought by
Hand James Morris and Hand Lori Grove
Current Estimated Value
Home Financials for this Owner
Home Financials are based on the most recent Mortgage that was taken out on this home.
Original Mortgage
$378,400
Outstanding Balance
$259,894
Interest Rate
4.17%
Mortgage Type
New Conventional
Estimated Equity
$929,399
Purchase Details
Closed on
Dec 31, 1993
Sold by
Eldon Miller Homes Inc
Bought by
Hessler Bruce Colleen K
Home Financials for this Owner
Home Financials are based on the most recent Mortgage that was taken out on this home.
Original Mortgage
$203,150
Interest Rate
7.1%
Create a Home Valuation Report for This Property
The Home Valuation Report is an in-depth analysis detailing your home's value as well as a comparison with similar homes in the area
Home Values in the Area
Average Home Value in this Area
Purchase History
| Date | Buyer | Sale Price | Title Company |
|---|---|---|---|
| Hand James Morris | $473,000 | -- | |
| Hessler Bruce Colleen K | $292,500 | -- |
Source: Public Records
Mortgage History
| Date | Status | Borrower | Loan Amount |
|---|---|---|---|
| Open | Hand James Morris | $378,400 | |
| Closed | Hand James Morris | $40,000 | |
| Previous Owner | Hessler Bruce Colleen K | $203,150 | |
| Closed | Hessler Bruce Colleen K | $30,750 |
Source: Public Records
Tax History Compared to Growth
Tax History
| Year | Tax Paid | Tax Assessment Tax Assessment Total Assessment is a certain percentage of the fair market value that is determined by local assessors to be the total taxable value of land and additions on the property. | Land | Improvement |
|---|---|---|---|---|
| 2025 | $1,287 | $401,760 | $138,280 | $263,480 |
| 2023 | $1,287 | $304,960 | $86,160 | $218,800 |
| 2022 | $7,034 | $249,200 | $69,000 | $180,200 |
| 2021 | $6,809 | $229,080 | $65,920 | $163,160 |
| 2020 | $6,854 | $226,320 | $65,120 | $161,200 |
| 2019 | $1,086 | $222,360 | $64,000 | $158,360 |
| 2018 | $5,787 | $217,120 | $62,480 | $154,640 |
| 2017 | $4,799 | $176,600 | $52,760 | $123,840 |
| 2016 | $4,774 | $176,600 | $52,760 | $123,840 |
| 2015 | $5,351 | $168,400 | $52,760 | $115,640 |
| 2014 | $4,771 | $168,400 | $52,760 | $115,640 |
Source: Public Records
Map
Nearby Homes
- 4465 Park Brooke Trace Unit 5
- 3965 Brookline Dr
- 3010 Brooke View Ct Unit 5
- 4255 Park Brooke Trace
- 4345 Park Brooke Trace
- 4462 Hawthorn Cir
- 4465 Hawthorn Cir
- 3962 Erin Dr
- 4475 Hawthorn Cir
- 105 Kimball Bridge Cove
- 11125 Pinehigh Dr
- 517 Boardwalk Way
- 515 Boardwalk Way
- 345 Kincardine Way Unit IIIA
- 4305 Pine Vista Blvd
- 3750 Brookside Pkwy Unit 37413033
- 10880 Windham Way
- 460 Park Creek Way
- 480 Park Creek Way
- 450 Park Creek Way
- 435 Park Creek Way Unit 2
- 435 Park Creek Way
- 437 Argosy Park Cir
- 445 Park Creek Way
- 500 Park Creek Way
- 490 Park Creek Way Unit 2
- 425 Park Creek Way Unit 2
- 440 Park Creek Way
- 430 Park Creek Way
- 455 Park Creek Way Unit 2
- 510 Park Creek Way
- 415 Park Creek Way
- 4445 Park Brooke Trace Unit 5
- 420 Park Creek Way Unit 2
- 0 Park Creek Way Unit 7203695
- 4435 Park Brooke Trace
- 4020 Brookline Dr Unit 1