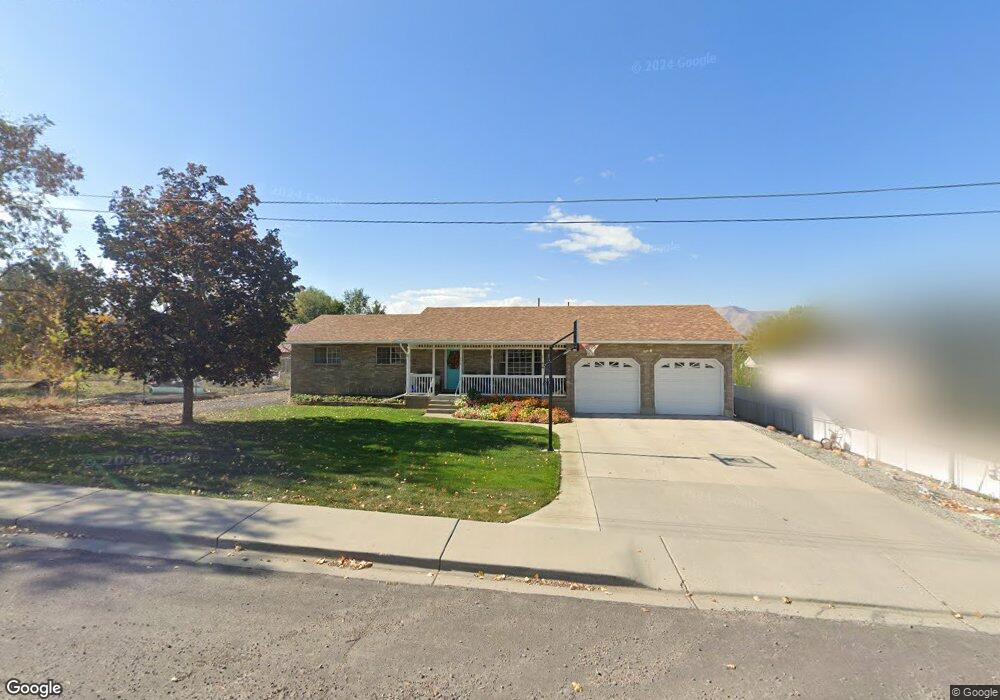
470 S 400 W Payson, UT 84651
Estimated Value: $517,000 - $635,747
6
Beds
3
Baths
3,338
Sq Ft
$172/Sq Ft
Est. Value
About This Home
This home is located at 470 S 400 W, Payson, UT 84651 and is currently estimated at $573,249, approximately $171 per square foot. 470 S 400 W is a home located in Utah County with nearby schools including Wilson Elementary School, Mt. Nebo Middle, and Payson Junior High School.
Ownership History
Date
Name
Owned For
Owner Type
Purchase Details
Closed on
Sep 29, 2025
Sold by
Oneal Mary G and Oneal Richard C
Bought by
Oneal Irrevocable Trust and Oneal
Current Estimated Value
Purchase Details
Closed on
Aug 3, 2015
Sold by
Neal Mary G O and Neal Richard C O
Bought by
Neal Jennifer O
Purchase Details
Closed on
Nov 20, 1997
Sold by
Anderson S Lee and Andersone Annette
Bought by
Oneal Mary G and Oneal Richard C
Home Financials for this Owner
Home Financials are based on the most recent Mortgage that was taken out on this home.
Original Mortgage
$122,500
Interest Rate
7.33%
Create a Home Valuation Report for This Property
The Home Valuation Report is an in-depth analysis detailing your home's value as well as a comparison with similar homes in the area
Home Values in the Area
Average Home Value in this Area
Purchase History
| Date | Buyer | Sale Price | Title Company |
|---|---|---|---|
| Oneal Irrevocable Trust | -- | None Listed On Document | |
| Neal Jennifer O | -- | None Available | |
| Oneal Mary G | -- | -- |
Source: Public Records
Mortgage History
| Date | Status | Borrower | Loan Amount |
|---|---|---|---|
| Previous Owner | Oneal Mary G | $122,500 |
Source: Public Records
Tax History
| Year | Tax Paid | Tax Assessment Tax Assessment Total Assessment is a certain percentage of the fair market value that is determined by local assessors to be the total taxable value of land and additions on the property. | Land | Improvement |
|---|---|---|---|---|
| 2025 | $3,133 | $340,285 | -- | -- |
| 2024 | $3,133 | $318,890 | $0 | $0 |
| 2023 | $3,182 | $324,720 | $0 | $0 |
| 2022 | $2,866 | $287,650 | $0 | $0 |
| 2021 | $2,370 | $381,500 | $110,100 | $271,400 |
| 2020 | $2,221 | $349,800 | $95,700 | $254,100 |
| 2019 | $1,998 | $322,600 | $82,600 | $240,000 |
| 2018 | $1,890 | $294,100 | $69,600 | $224,500 |
| 2017 | $1,723 | $144,210 | $0 | $0 |
| 2016 | $1,640 | $136,400 | $0 | $0 |
| 2015 | $1,622 | $133,980 | $0 | $0 |
| 2014 | $1,482 | $123,255 | $0 | $0 |
Source: Public Records
Map
Nearby Homes
- 533 S 700 W
- 549 S Main St
- 128 S 300 W
- 116 S 300 W
- 742 W 400 S
- 1836 S 100 E
- 626 S 800 W Unit 32
- 588 W Utah Ave
- 229 E 670 S Unit 7
- 116 E 100 S
- 225 S Majestic Meadows Dr
- 221 S Majestic Meadows Dr
- 252 E 670 S Unit 2
- 227 S Majestic Meadows Dr
- 252 S 400 E
- 118 E 100 N
- 420 E 600 S
- 815 S Canyon Rd
- 195 W 300 N
- 846 S 880 W
Your Personal Tour Guide
Ask me questions while you tour the home.