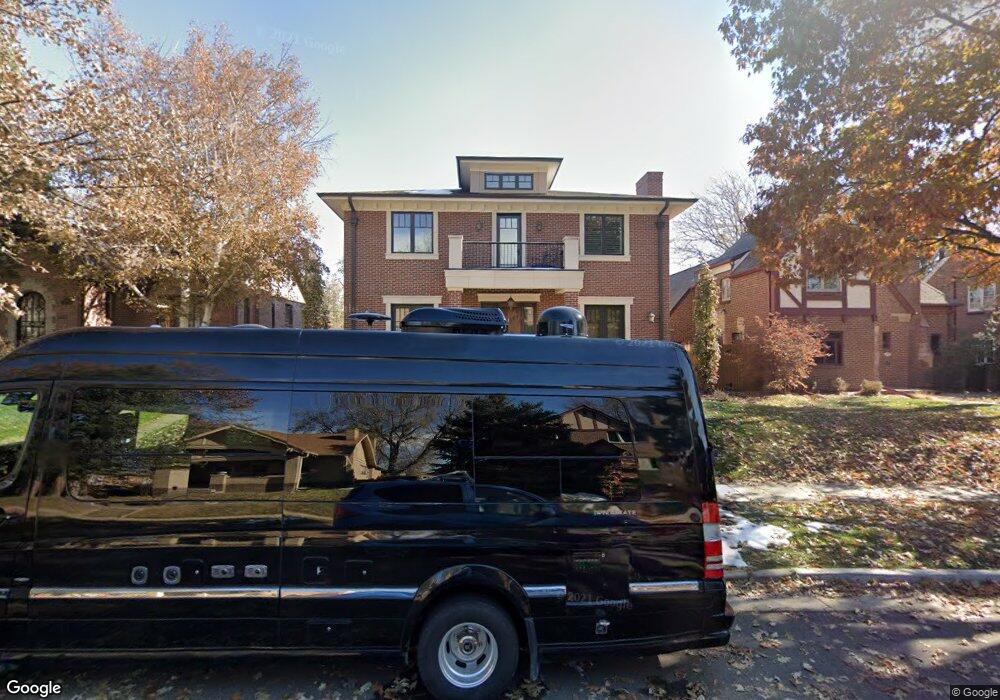
470 S York St Denver, CO 80209
Washington Park NeighborhoodEstimated Value: $3,270,000 - $3,718,000
5
Beds
6
Baths
6,021
Sq Ft
$575/Sq Ft
Est. Value
About This Home
This home is located at 470 S York St, Denver, CO 80209 and is currently estimated at $3,460,872, approximately $574 per square foot. 470 S York St is a home located in Denver County with nearby schools including Steele Elementary School, Merrill Middle School, and South High School.
Ownership History
Date
Name
Owned For
Owner Type
Purchase Details
Closed on
Dec 3, 2020
Sold by
The Mark Carleton Living Trust
Bought by
Boland Nancy S and Boland Luke D
Current Estimated Value
Purchase Details
Closed on
Jan 11, 2019
Sold by
Carleton Mark
Bought by
The Mark Carleton Living Trust
Purchase Details
Closed on
Jun 13, 2014
Sold by
Ens Investments Llc
Bought by
Carleton Mark
Purchase Details
Closed on
May 9, 2013
Sold by
Mod Designs Llc
Bought by
Ens Investments Llc
Home Financials for this Owner
Home Financials are based on the most recent Mortgage that was taken out on this home.
Original Mortgage
$350,000
Interest Rate
4.5%
Mortgage Type
Purchase Money Mortgage
Purchase Details
Closed on
Dec 27, 2012
Sold by
Belimar Richard K and Belimar Margaret F
Bought by
Mod Designs Llc
Home Financials for this Owner
Home Financials are based on the most recent Mortgage that was taken out on this home.
Original Mortgage
$230,000
Interest Rate
11%
Mortgage Type
Purchase Money Mortgage
Purchase Details
Closed on
Nov 26, 1999
Sold by
Bellmar Margaret F
Bought by
Bellmar Margaret F and Bellmar Richard K
Create a Home Valuation Report for This Property
The Home Valuation Report is an in-depth analysis detailing your home's value as well as a comparison with similar homes in the area
Home Values in the Area
Average Home Value in this Area
Purchase History
| Date | Buyer | Sale Price | Title Company |
|---|---|---|---|
| Boland Nancy S | $2,560,000 | Land Title Guarantee Co | |
| The Mark Carleton Living Trust | -- | None Available | |
| Carleton Mark | $1,740,000 | Fidelity National Title Ins | |
| Ens Investments Llc | $500,000 | First American | |
| Mod Designs Llc | $415,000 | First American | |
| Bellmar Margaret F | -- | -- |
Source: Public Records
Mortgage History
| Date | Status | Borrower | Loan Amount |
|---|---|---|---|
| Previous Owner | Ens Investments Llc | $350,000 | |
| Previous Owner | Mod Designs Llc | $230,000 |
Source: Public Records
Tax History Compared to Growth
Tax History
| Year | Tax Paid | Tax Assessment Tax Assessment Total Assessment is a certain percentage of the fair market value that is determined by local assessors to be the total taxable value of land and additions on the property. | Land | Improvement |
|---|---|---|---|---|
| 2024 | $16,500 | $208,330 | $61,810 | $146,520 |
| 2023 | $16,143 | $208,330 | $61,810 | $146,520 |
| 2022 | $11,339 | $142,580 | $53,520 | $89,060 |
| 2021 | $10,945 | $146,680 | $55,060 | $91,620 |
| 2020 | $12,482 | $168,230 | $50,830 | $117,400 |
| 2019 | $12,132 | $168,230 | $50,830 | $117,400 |
| 2018 | $10,679 | $138,040 | $40,520 | $97,520 |
| 2017 | $10,648 | $138,040 | $40,520 | $97,520 |
| 2016 | $10,728 | $131,550 | $40,079 | $91,471 |
| 2015 | $10,278 | $131,550 | $40,079 | $91,471 |
| 2014 | $4,363 | $52,530 | $23,578 | $28,952 |
Source: Public Records
Map
Nearby Homes
- 464 S Gaylord St
- 442 S Vine St
- 343 S Gaylord St
- 582 S York St
- 590 S York St
- 457 S Vine St
- 595 S Gaylord St
- 536 S Race St
- 2155 E Alameda Ave
- 501 S Race St
- 560 S Race St
- 675 S University Blvd Unit 206
- 601 S Vine St
- 648 S Gaylord St
- 2111 E Alameda Ave
- 352 S High St
- 680 S Gaylord St
- 684 S Gaylord St
- 2417 E Cedar Ave
- 656 S Race St
- 460 S York St
- 472 S York St
- 480 S York St
- 467 S University Blvd
- 490 S York St
- 475 S University Blvd
- 459 S University Blvd
- 483 S University Blvd
- 451 S University Blvd
- 469 S York St
- 461 S York St
- 477 S York St
- 455 S York St
- 434 S York St
- 495 S University Blvd
- 443 S University Blvd
- 485 S York St
- 445 S York St
- 495 S York St
- 435 S University Blvd