Estimated Value: $161,573 - $186,000
3
Beds
2
Baths
1,100
Sq Ft
$160/Sq Ft
Est. Value
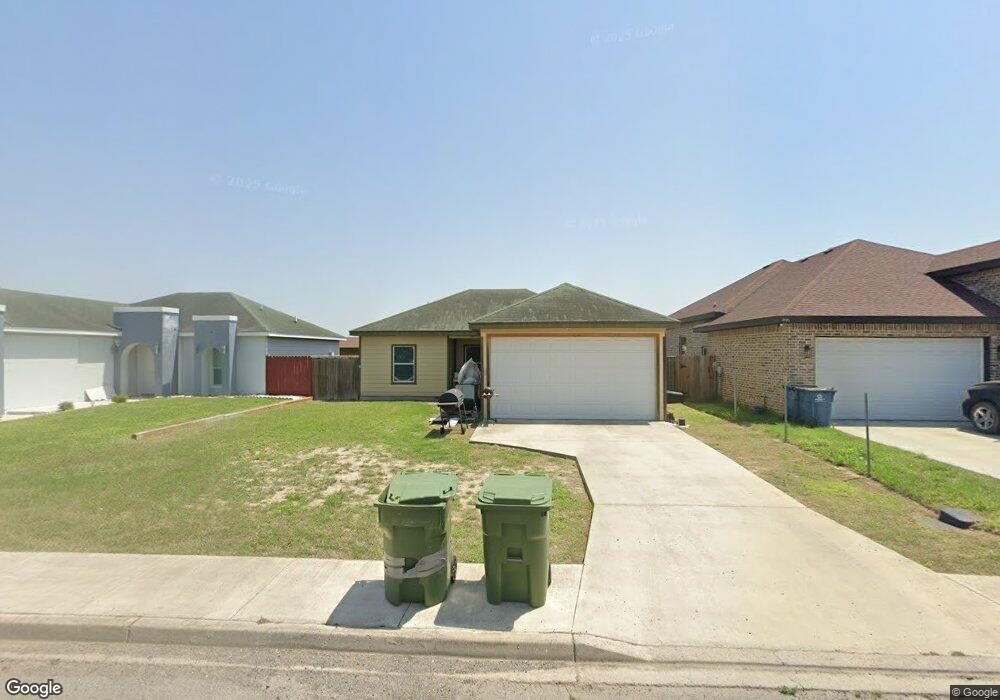
About This Home
This home is located at 470 Serg Loop, Alamo, TX 78516 and is currently estimated at $175,893, approximately $159 per square foot. 470 Serg Loop is a home located in Hidalgo County with nearby schools including Capt. D. Salinas Elementary School, A.P. Solis Middle School, and Donna High School.
Ownership History
Date
Name
Owned For
Owner Type
Purchase Details
Closed on
Nov 20, 2015
Sold by
Rodriguez David and Rodriguez Tanya
Bought by
Rivas Adolfo and Rivas Maria Veronica
Current Estimated Value
Home Financials for this Owner
Home Financials are based on the most recent Mortgage that was taken out on this home.
Original Mortgage
$3,500
Interest Rate
3.81%
Mortgage Type
Stand Alone Second
Create a Home Valuation Report for This Property
The Home Valuation Report is an in-depth analysis detailing your home's value as well as a comparison with similar homes in the area
Home Values in the Area
Average Home Value in this Area
Purchase History
| Date | Buyer | Sale Price | Title Company |
|---|---|---|---|
| Rivas Adolfo | -- | Sierra Title | |
| Rodriguez David | -- | Sierra Title |
Source: Public Records
Mortgage History
| Date | Status | Borrower | Loan Amount |
|---|---|---|---|
| Closed | Rodriguez David | $3,500 | |
| Open | Rivas Adolfo | $76,125 |
Source: Public Records
Tax History
| Year | Tax Paid | Tax Assessment Tax Assessment Total Assessment is a certain percentage of the fair market value that is determined by local assessors to be the total taxable value of land and additions on the property. | Land | Improvement |
|---|---|---|---|---|
| 2025 | $1,977 | $130,233 | -- | -- |
| 2024 | $1,977 | $118,394 | -- | -- |
| 2023 | $2,740 | $107,631 | $0 | $0 |
| 2022 | $2,437 | $93,562 | $0 | $0 |
| 2021 | $2,232 | $85,056 | $25,000 | $77,226 |
| 2020 | $2,096 | $77,324 | $22,813 | $67,347 |
| 2019 | $1,920 | $70,014 | $22,813 | $47,201 |
| 2018 | $1,935 | $71,018 | $22,813 | $48,205 |
| 2017 | $1,818 | $65,896 | $17,188 | $48,708 |
| 2016 | $1,693 | $61,359 | $17,188 | $44,171 |
| 2015 | $310 | $61,811 | $17,188 | $44,623 |
Source: Public Records
Map
Nearby Homes
Your Personal Tour Guide
Ask me questions while you tour the home.