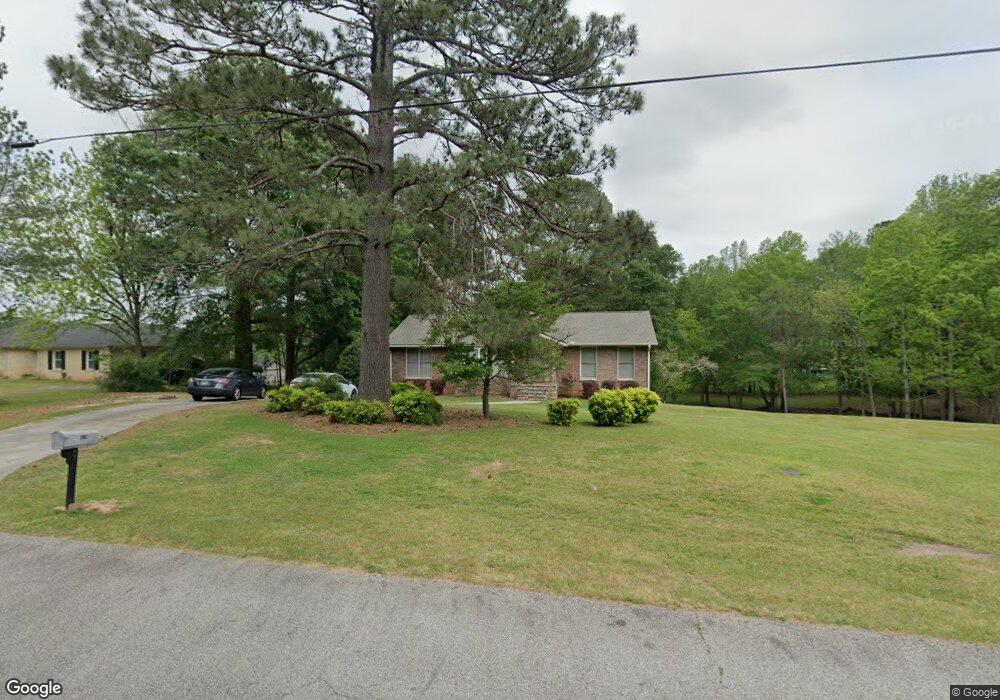
470 Sivell Rd Lagrange, GA 30241
Estimated Value: $246,000 - $288,000
3
Beds
2
Baths
1,608
Sq Ft
$164/Sq Ft
Est. Value
About This Home
This home is located at 470 Sivell Rd, Lagrange, GA 30241 and is currently estimated at $264,218, approximately $164 per square foot. 470 Sivell Rd is a home located in Troup County with nearby schools including Callaway Elementary School, Hogansville Elementary School, and Callaway Middle School.
Ownership History
Date
Name
Owned For
Owner Type
Purchase Details
Closed on
Sep 5, 2025
Sold by
Borders Philip G
Bought by
Borders Debra Jean Tr and Borders Philip Grant Tr
Current Estimated Value
Purchase Details
Closed on
Oct 17, 1994
Sold by
John A Bierholm
Bought by
Borders Philip G and Borders Debra J
Purchase Details
Closed on
Oct 1, 1986
Sold by
Mclean Andrew F and Mclean Bruce E
Bought by
John A Bierholm
Purchase Details
Closed on
Dec 1, 1984
Sold by
Joe C Thomas
Bought by
Mclean Andrew F and Mclean Bruce E
Create a Home Valuation Report for This Property
The Home Valuation Report is an in-depth analysis detailing your home's value as well as a comparison with similar homes in the area
Purchase History
| Date | Buyer | Sale Price | Title Company |
|---|---|---|---|
| Borders Debra Jean Tr | -- | -- | |
| Borders Philip G | $86,500 | -- | |
| John A Bierholm | $10,400 | -- | |
| Mclean Andrew F | -- | -- |
Source: Public Records
Tax History
| Year | Tax Paid | Tax Assessment Tax Assessment Total Assessment is a certain percentage of the fair market value that is determined by local assessors to be the total taxable value of land and additions on the property. | Land | Improvement |
|---|---|---|---|---|
| 2025 | $2,317 | $89,160 | $12,480 | $76,680 |
| 2024 | $2,207 | $82,920 | $12,480 | $70,440 |
| 2023 | $1,969 | $74,200 | $12,480 | $61,720 |
| 2022 | $1,910 | $70,440 | $12,480 | $57,960 |
| 2021 | $1,561 | $53,760 | $10,000 | $43,760 |
| 2020 | $1,561 | $53,760 | $10,000 | $43,760 |
| 2019 | $1,412 | $48,800 | $6,000 | $42,800 |
| 2018 | $1,343 | $46,520 | $6,120 | $40,400 |
| 2017 | $1,343 | $46,520 | $6,120 | $40,400 |
| 2016 | $1,340 | $46,418 | $6,140 | $40,278 |
| 2015 | $1,343 | $46,418 | $6,140 | $40,278 |
| 2014 | $1,281 | $44,298 | $6,140 | $38,158 |
| 2013 | -- | $46,369 | $6,140 | $40,229 |
Source: Public Records
Map
Nearby Homes
- SMOKEMONT Smokemont Dr
- 10 Whitfield Rd
- 883 Hammett Rd
- 789 Hammett Rd
- 119 Sir Lancelot St
- 300 Old Pond Rd
- 124 Woodridge Cir
- 105 Ridgefield Dr
- 200 Freshwater Ct Unit 37
- 402 Sweetwood Ct Unit LOT 2
- 234 River Meadow Dr
- 202 Freshwater Ct Unit E36
- 202 Freshwater Ct
- 204 Freshwater Ct
- 206 Freshwater Ct Unit 34E
- 206 Freshwater Ct
- 124 Shenandoah Ln
- 200 River Meadow Dr
- 114 Shenandoah Ln
- 304 Bridgette Blvd
Your Personal Tour Guide
Ask me questions while you tour the home.