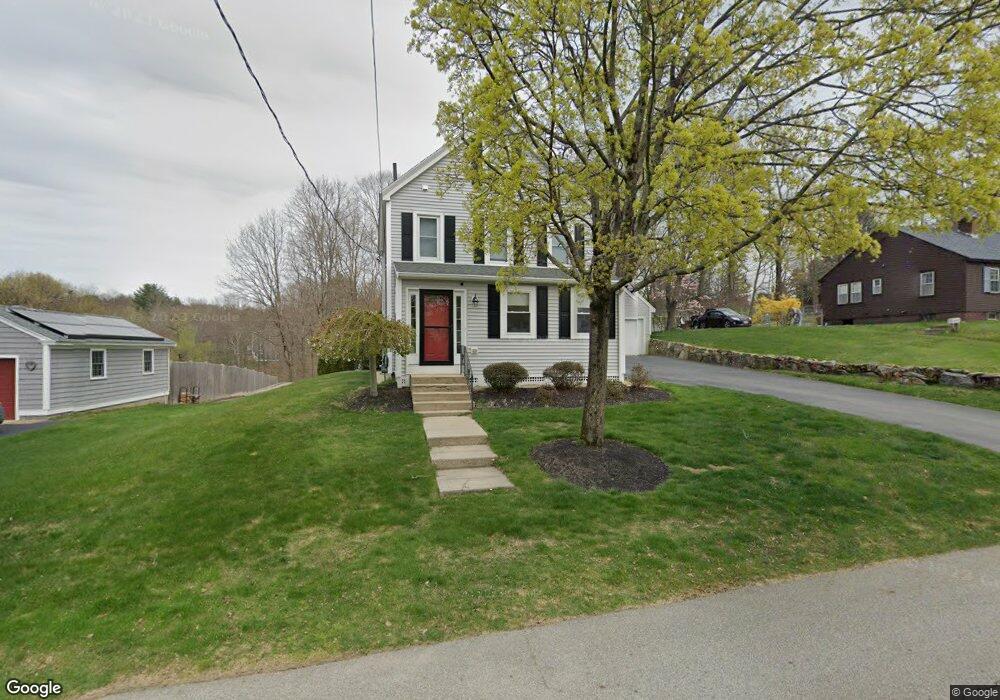
470 Stevens St North Andover, MA 01845
Estimated Value: $742,044 - $854,000
3
Beds
2
Baths
2,160
Sq Ft
$370/Sq Ft
Est. Value
About This Home
This home is located at 470 Stevens St, North Andover, MA 01845 and is currently estimated at $800,011, approximately $370 per square foot. 470 Stevens St is a home located in Essex County with nearby schools including Franklin Elementary School, North Andover Middle School, and North Andover High School.
Ownership History
Date
Name
Owned For
Owner Type
Purchase Details
Closed on
Mar 4, 2004
Sold by
Oliveto Frank S and Oliveto Laura L
Bought by
Oliveto Frank S and Oliveto Laura L
Current Estimated Value
Purchase Details
Closed on
May 28, 2003
Sold by
Mcdermott John P and Mcdermott Mary F
Bought by
Oliveto Frank S and Scola Laura L
Home Financials for this Owner
Home Financials are based on the most recent Mortgage that was taken out on this home.
Original Mortgage
$319,920
Interest Rate
5.86%
Mortgage Type
Purchase Money Mortgage
Create a Home Valuation Report for This Property
The Home Valuation Report is an in-depth analysis detailing your home's value as well as a comparison with similar homes in the area
Home Values in the Area
Average Home Value in this Area
Purchase History
| Date | Buyer | Sale Price | Title Company |
|---|---|---|---|
| Oliveto Frank S | -- | -- | |
| Oliveto Frank S | $399,900 | -- |
Source: Public Records
Mortgage History
| Date | Status | Borrower | Loan Amount |
|---|---|---|---|
| Previous Owner | Oliveto Frank S | $319,920 |
Source: Public Records
Tax History Compared to Growth
Tax History
| Year | Tax Paid | Tax Assessment Tax Assessment Total Assessment is a certain percentage of the fair market value that is determined by local assessors to be the total taxable value of land and additions on the property. | Land | Improvement |
|---|---|---|---|---|
| 2025 | $6,887 | $611,600 | $311,000 | $300,600 |
| 2024 | $6,493 | $585,500 | $292,700 | $292,800 |
| 2023 | $6,403 | $523,100 | $269,000 | $254,100 |
| 2022 | $6,363 | $470,300 | $241,500 | $228,800 |
| 2021 | $6,124 | $432,200 | $219,600 | $212,600 |
| 2020 | $5,938 | $432,200 | $219,600 | $212,600 |
| 2019 | $5,796 | $432,200 | $219,600 | $212,600 |
| 2018 | $6,714 | $462,100 | $219,600 | $242,500 |
| 2017 | $5,993 | $419,700 | $185,100 | $234,600 |
| 2016 | $5,968 | $418,200 | $181,600 | $236,600 |
| 2015 | $5,418 | $376,500 | $175,400 | $201,100 |
Source: Public Records
Map
Nearby Homes
- 479 Stevens St
- 3 Great Pond Rd
- 447 Stevens St
- 174 Chestnut St Unit 14
- 124 Quail Run Rd
- 136 Quail Run Rd
- 80 Sandra Ln
- 180 Chickering Rd Unit 310C
- 116 Mill Pond
- 115 Mill Pond
- 112 Mill Pond
- 19 Fernview Ave Unit 6
- 19 Fernview Ave Unit 5
- 25 Fernview Ave Unit 8
- 23 Fernview Ave Unit 1
- 40 Fernview Ave Unit 11
- 35 Fernview Ave Unit 5
- 98 Mill Pond
- 52 Fernview Ave Unit 7
- 16 Court St
- 460 Stevens St
- 474 Stevens St
- 465 Stevens St
- 465 Stevens St Unit 465
- 454 Stevens St
- 459 Stevens St
- 461 Stevens St
- 469 Stevens St
- 475 Stevens St Unit 477
- 455 Stevens St
- 24 Salem St
- 481 Stevens St
- 450 Stevens St
- 451 Stevens St
- 453 Stevens St
- 10 Salem St
- 38 Johnson St Unit 1
- 36 Johnson St Unit 1
- 36 Johnson St Unit 36
- 38 Johnson St