Estimated Value: $333,441 - $371,000
3
Beds
1
Bath
1,056
Sq Ft
$335/Sq Ft
Est. Value
About This Home
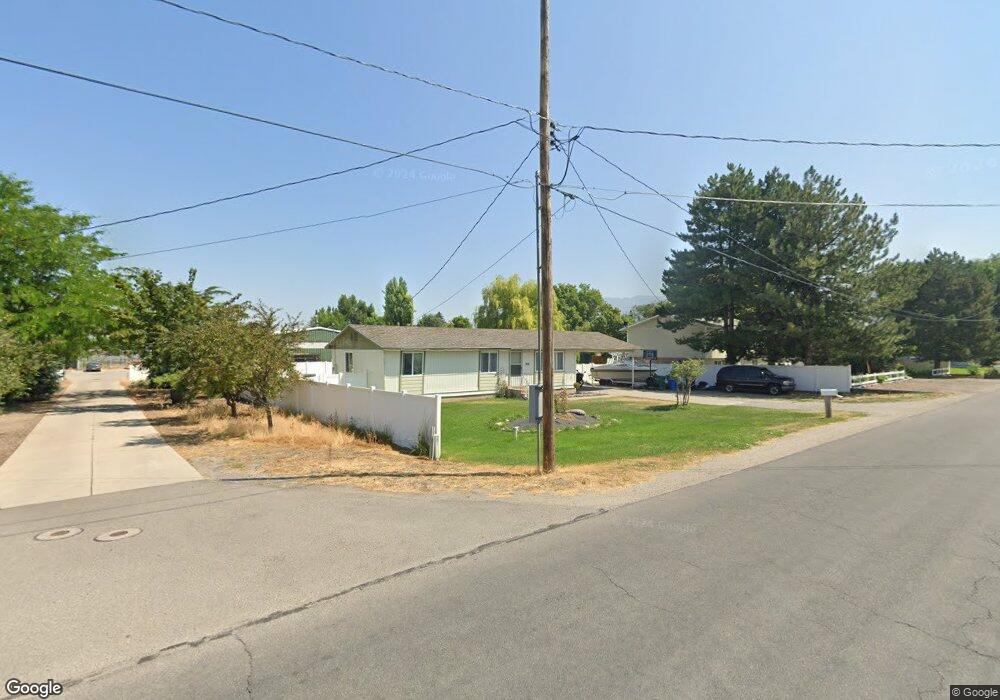
This home is located at 470 W 200 N, Hyrum, UT 84319 and is currently estimated at $353,360, approximately $334 per square foot. 470 W 200 N is a home located in Cache County with nearby schools including Lincoln School, South Cache Middle School, and Mountain Crest High School.
Ownership History
Date
Name
Owned For
Owner Type
Purchase Details
Closed on
Oct 11, 2016
Sold by
Maughan Lrry C and Maughan Terri R
Bought by
Peterson Earl D and Peterson Sherry R
Current Estimated Value
Purchase Details
Closed on
Oct 5, 2016
Sold by
Maughan Larry C and Maughan Terri R
Bought by
Maughan Larry C and Maughan Terri R
Purchase Details
Closed on
Dec 15, 2008
Sold by
Maughan Larry C and Maughan Terri R
Bought by
Trm Properties Llc
Purchase Details
Closed on
Dec 4, 2008
Sold by
Trm Properties Llc
Bought by
Maughan Larry C and Maughan Terri R
Purchase Details
Closed on
May 16, 2008
Sold by
Palmer Douglas R and Palmer Carisa A
Bought by
Maughan Larry C and Maughan Terri R
Home Financials for this Owner
Home Financials are based on the most recent Mortgage that was taken out on this home.
Original Mortgage
$100,880
Interest Rate
5.88%
Mortgage Type
New Conventional
Create a Home Valuation Report for This Property
The Home Valuation Report is an in-depth analysis detailing your home's value as well as a comparison with similar homes in the area
Home Values in the Area
Average Home Value in this Area
Purchase History
| Date | Buyer | Sale Price | Title Company |
|---|---|---|---|
| Peterson Earl D | -- | None Available | |
| Maughan Larry C | -- | Heritage Title | |
| Trm Properties Llc | -- | None Available | |
| Maughan Larry C | -- | Heritage Title Ins Ag Inc Lo | |
| Maughan Larry C | -- | Heritage Title | |
| Maughan Larry C | -- | Heritage Title |
Source: Public Records
Mortgage History
| Date | Status | Borrower | Loan Amount |
|---|---|---|---|
| Previous Owner | Maughan Larry C | $100,880 |
Source: Public Records
Tax History Compared to Growth
Tax History
| Year | Tax Paid | Tax Assessment Tax Assessment Total Assessment is a certain percentage of the fair market value that is determined by local assessors to be the total taxable value of land and additions on the property. | Land | Improvement |
|---|---|---|---|---|
| 2025 | $1,042 | $149,650 | $0 | $0 |
| 2024 | $1,112 | $149,045 | $0 | $0 |
| 2023 | $1,107 | $141,915 | $0 | $0 |
| 2022 | $1,155 | $141,910 | $0 | $0 |
| 2021 | $1,128 | $213,490 | $65,050 | $148,440 |
| 2020 | $1,063 | $188,750 | $65,050 | $123,700 |
| 2019 | $953 | $159,171 | $39,170 | $120,001 |
| 2018 | $872 | $140,866 | $39,170 | $101,696 |
| 2017 | $853 | $71,485 | $0 | $0 |
| 2016 | $872 | $63,755 | $0 | $0 |
| 2015 | $780 | $63,755 | $0 | $0 |
| 2014 | $653 | $54,565 | $0 | $0 |
| 2013 | -- | $54,565 | $0 | $0 |
Source: Public Records
Map
Nearby Homes