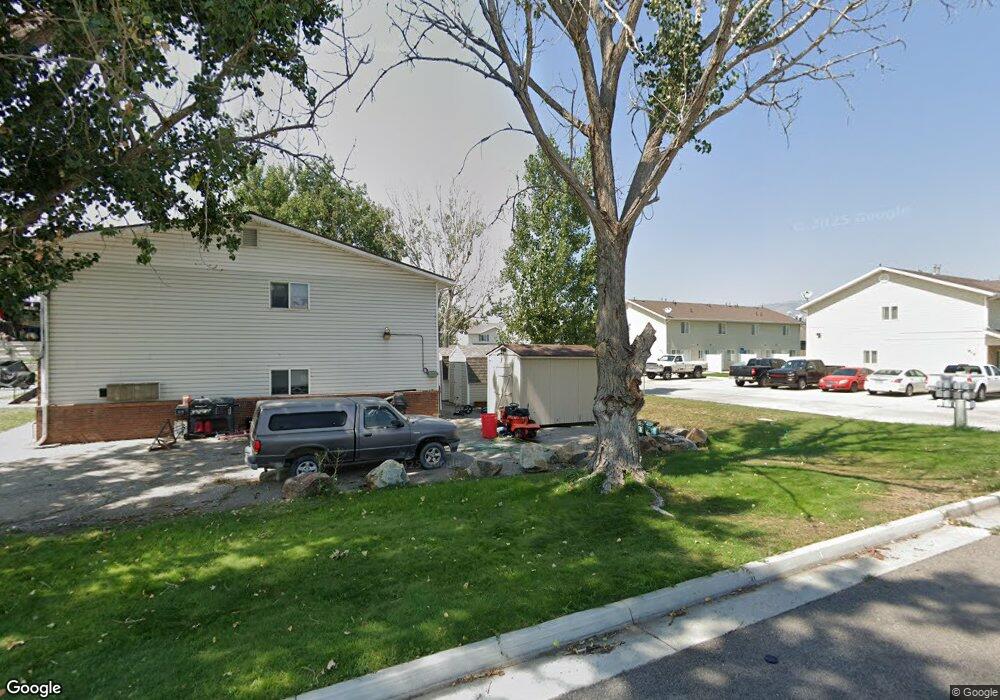
470 W 400 N Unit 2 Tremonton, UT 84337
Estimated Value: $352,928 - $503,000
--
Bed
--
Bath
1,960
Sq Ft
$210/Sq Ft
Est. Value
About This Home
This home is located at 470 W 400 N Unit 2, Tremonton, UT 84337 and is currently estimated at $410,976, approximately $209 per square foot. 470 W 400 N Unit 2 is a home located in Box Elder County with nearby schools including North Park School, Alice C. Harris Intermediate School, and Bear River Middle School.
Ownership History
Date
Name
Owned For
Owner Type
Purchase Details
Closed on
May 8, 2019
Sold by
Freeze Jeffery and Freeze Korie
Bought by
Mcnamara James A
Current Estimated Value
Home Financials for this Owner
Home Financials are based on the most recent Mortgage that was taken out on this home.
Original Mortgage
$271,000
Interest Rate
4%
Mortgage Type
VA
Purchase Details
Closed on
Jul 27, 2007
Sold by
Freeze Jeffrey and Freeze Korie
Bought by
Larkin Joseph D and Larkin Mandy M
Create a Home Valuation Report for This Property
The Home Valuation Report is an in-depth analysis detailing your home's value as well as a comparison with similar homes in the area
Home Values in the Area
Average Home Value in this Area
Purchase History
| Date | Buyer | Sale Price | Title Company |
|---|---|---|---|
| Mcnamara James A | -- | Stewart Title Ins Agcy Of Ut | |
| Larkin Joseph D | -- | Lincoln Title |
Source: Public Records
Mortgage History
| Date | Status | Borrower | Loan Amount |
|---|---|---|---|
| Previous Owner | Mcnamara James A | $271,000 |
Source: Public Records
Tax History Compared to Growth
Tax History
| Year | Tax Paid | Tax Assessment Tax Assessment Total Assessment is a certain percentage of the fair market value that is determined by local assessors to be the total taxable value of land and additions on the property. | Land | Improvement |
|---|---|---|---|---|
| 2025 | $1,418 | $314,338 | $16,106 | $298,232 |
| 2024 | $1,418 | $312,863 | $15,584 | $297,279 |
| 2023 | $1,295 | $288,684 | $11,360 | $277,324 |
| 2022 | $1,288 | $271,615 | $8,240 | $263,375 |
| 2021 | $661 | $125,059 | $3,900 | $121,159 |
| 2020 | $683 | $125,059 | $3,900 | $121,159 |
| 2019 | $593 | $400 | $200 | $200 |
| 2018 | $635 | $57,601 | $2,070 | $55,531 |
| 2017 | $658 | $104,566 | $2,070 | $100,966 |
| 2016 | $465 | $41,023 | $2,070 | $38,953 |
| 2015 | $449 | $41,023 | $2,070 | $38,953 |
| 2014 | $449 | $39,168 | $2,070 | $37,098 |
| 2013 | -- | $39,168 | $1,870 | $37,298 |
Source: Public Records
Map
Nearby Homes
- 476 W 450 N
- 931 W 910 N
- 678 600 W
- 688 600 W
- 696 600 W
- 702 600 W
- 691 W 600 N
- 711 N 600 W
- 711 N 600 W Unit 113
- 719 N 600 W
- 719 N 600 W Unit 112
- 725 N 600 W
- 725 N 600 W Unit 111
- 733 N 600 W
- 733 N 600 W Unit 110
- 855 W 350 N
- 678 N 600 W Unit 103
- 688 N 600 W Unit 104
- 696 N 600 W Unit 105
- 702 N 600 W Unit 106