Estimated Value: $461,000 - $530,000
5
Beds
2
Baths
1,393
Sq Ft
$358/Sq Ft
Est. Value
About This Home
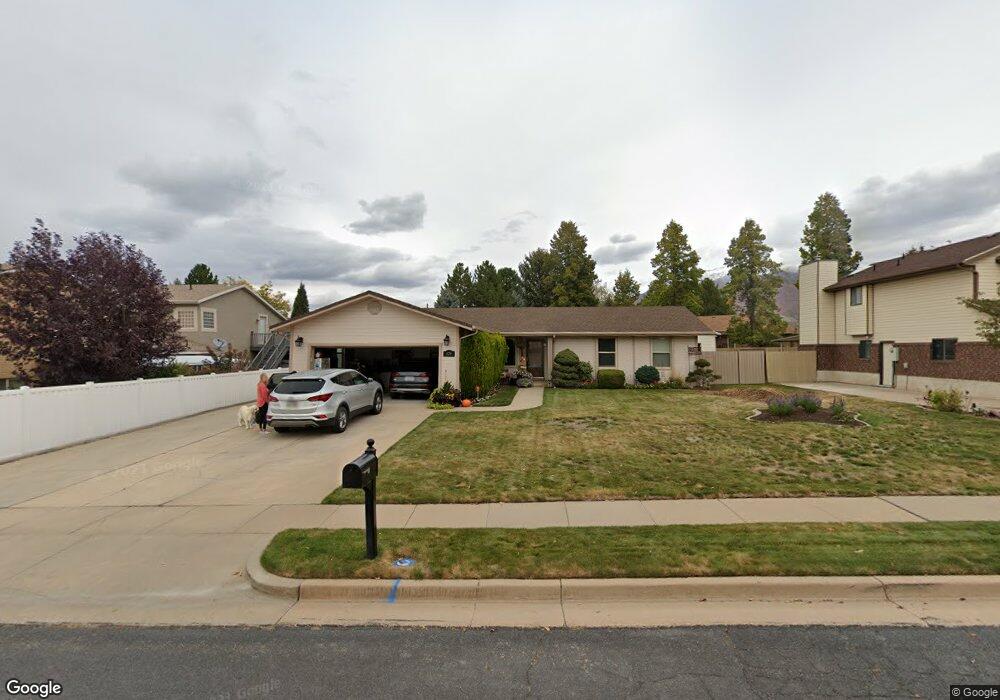
This home is located at 470 W 5600 S, Ogden, UT 84405 and is currently estimated at $499,354, approximately $358 per square foot. 470 W 5600 S is a home located in Weber County with nearby schools including Roosevelt School, T.H. Bell Junior High School, and Bonneville High School.
Ownership History
Date
Name
Owned For
Owner Type
Purchase Details
Closed on
Mar 6, 2024
Sold by
Lloyd William L and Revoca Sheri
Bought by
Cosby Landon M and Cosby Mckinlee A
Current Estimated Value
Home Financials for this Owner
Home Financials are based on the most recent Mortgage that was taken out on this home.
Original Mortgage
$500,762
Outstanding Balance
$490,089
Interest Rate
6.69%
Mortgage Type
FHA
Estimated Equity
$9,265
Purchase Details
Closed on
Apr 30, 2018
Sold by
Lloyd William L and Lloyd Sheri L
Bought by
Lloyd William L and Lloyd Sheri L
Create a Home Valuation Report for This Property
The Home Valuation Report is an in-depth analysis detailing your home's value as well as a comparison with similar homes in the area
Home Values in the Area
Average Home Value in this Area
Purchase History
| Date | Buyer | Sale Price | Title Company |
|---|---|---|---|
| Cosby Landon M | -- | Us Title | |
| Lloyd William L | -- | None Available |
Source: Public Records
Mortgage History
| Date | Status | Borrower | Loan Amount |
|---|---|---|---|
| Open | Cosby Landon M | $500,762 |
Source: Public Records
Tax History
| Year | Tax Paid | Tax Assessment Tax Assessment Total Assessment is a certain percentage of the fair market value that is determined by local assessors to be the total taxable value of land and additions on the property. | Land | Improvement |
|---|---|---|---|---|
| 2025 | $3,189 | $501,393 | $223,632 | $277,761 |
| 2024 | $3,054 | $270,599 | $122,997 | $147,602 |
| 2023 | $3,097 | $275,550 | $109,376 | $166,174 |
| 2022 | $3,040 | $277,200 | $93,011 | $184,189 |
| 2021 | $2,631 | $396,000 | $99,302 | $296,698 |
| 2020 | $2,410 | $331,000 | $84,393 | $246,607 |
| 2019 | $2,322 | $298,000 | $74,399 | $223,601 |
| 2018 | $2,057 | $260,000 | $74,399 | $185,601 |
| 2017 | $1,978 | $238,000 | $74,399 | $163,601 |
| 2016 | $1,785 | $118,732 | $36,412 | $82,320 |
| 2015 | $1,576 | $102,698 | $33,669 | $69,029 |
| 2014 | $1,462 | $94,351 | $30,925 | $63,426 |
Source: Public Records
Map
Nearby Homes
- 5495 S 575 W
- 376 W 5300 S
- 245 W 5350 S
- 311 W 5200 S
- 232 W 5250 S
- 5170 S 600 W
- 445 W 5100 S
- 5581 S 100 W
- 209 W 5200 S
- 493 W 5100 S
- 5123 S 550 W
- 5019 S 500 W
- 246 W 5000 S
- 5488 S 250 E
- 4856 S 300 W
- 5142 S 300 E
- 5100 S 1050 W Unit G111
- 5100 S 1050 W Unit E33
- 5100 S 1050 W Unit C123
- 5100 S 1050 W Unit B92
Your Personal Tour Guide
Ask me questions while you tour the home.