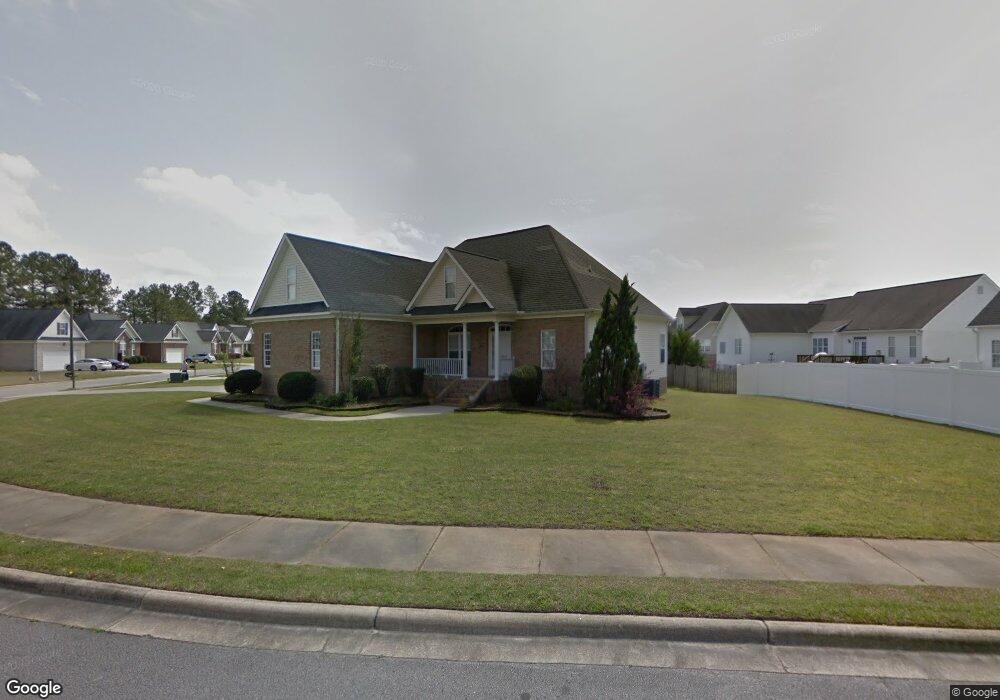
470 Williamston Dr Winterville, NC 28590
Estimated Value: $287,100 - $322,000
3
Beds
2
Baths
1,940
Sq Ft
$159/Sq Ft
Est. Value
About This Home
This home is located at 470 Williamston Dr, Winterville, NC 28590 and is currently estimated at $307,525, approximately $158 per square foot. 470 Williamston Dr is a home located in Pitt County with nearby schools including W.H. Robinson Elementary School, A.G. Cox Middle School, and South Central High School.
Ownership History
Date
Name
Owned For
Owner Type
Purchase Details
Closed on
Oct 12, 2006
Sold by
Bartholomew Brian Louis and Bartholomew Maria Lourdes
Bought by
Bartholomew Brian Louis and Bartholomew Maria Lourdes
Current Estimated Value
Home Financials for this Owner
Home Financials are based on the most recent Mortgage that was taken out on this home.
Original Mortgage
$210,498
Outstanding Balance
$126,174
Interest Rate
6.73%
Mortgage Type
New Conventional
Estimated Equity
$181,351
Purchase Details
Closed on
Aug 16, 2006
Sold by
Hope Builders Jc International Inc
Bought by
Bartholomew Brian Louis and Bartholomew Maria Louroles
Home Financials for this Owner
Home Financials are based on the most recent Mortgage that was taken out on this home.
Original Mortgage
$210,498
Outstanding Balance
$126,174
Interest Rate
6.73%
Mortgage Type
New Conventional
Estimated Equity
$181,351
Create a Home Valuation Report for This Property
The Home Valuation Report is an in-depth analysis detailing your home's value as well as a comparison with similar homes in the area
Home Values in the Area
Average Home Value in this Area
Purchase History
| Date | Buyer | Sale Price | Title Company |
|---|---|---|---|
| Bartholomew Brian Louis | -- | None Available | |
| Bartholomew Brian Louis | $208,000 | None Available |
Source: Public Records
Mortgage History
| Date | Status | Borrower | Loan Amount |
|---|---|---|---|
| Open | Bartholomew Brian Louis | $210,498 |
Source: Public Records
Tax History Compared to Growth
Tax History
| Year | Tax Paid | Tax Assessment Tax Assessment Total Assessment is a certain percentage of the fair market value that is determined by local assessors to be the total taxable value of land and additions on the property. | Land | Improvement |
|---|---|---|---|---|
| 2025 | $1,902 | $280,992 | $32,000 | $248,992 |
| 2024 | $1,890 | $280,992 | $32,000 | $248,992 |
| 2023 | $1,571 | $196,060 | $24,000 | $172,060 |
| 2022 | $1,578 | $196,060 | $24,000 | $172,060 |
| 2021 | $1,571 | $196,060 | $24,000 | $172,060 |
| 2020 | $1,580 | $196,060 | $24,000 | $172,060 |
| 2019 | $1,465 | $179,004 | $24,000 | $155,004 |
| 2018 | $1,399 | $179,004 | $24,000 | $155,004 |
| 2017 | $1,399 | $179,004 | $24,000 | $155,004 |
| 2016 | $1,395 | $179,004 | $24,000 | $155,004 |
| 2015 | $1,395 | $181,734 | $35,200 | $146,534 |
| 2014 | $1,395 | $181,734 | $35,200 | $146,534 |
Source: Public Records
Map
Nearby Homes
- 334 Gayle Blvd
- 2335 Wedgewood Dr
- 561 Channel Dr
- 2414 Glenda St
- 433 Drexel Ln
- 626 Winterfield Dr
- 4695 Old Tar Rd
- 2523 Jones St
- 2458 Jones St
- 2537 Jones St
- 2531 Jones St
- 2520 Ange St
- 227 Hammond St
- 626 Edenbrook Dr
- 2136 Winder Dr
- 334 Vernon White Rd
- 2243 Black Horse Ln
- 483 Primrose Ln
- 731 Winterfield Dr
- 272 Primrose Ln
- 482 Williamston Dr
- 2407 Lillington Ct
- 2415 Lillington Ct
- 488 Williamston Dr
- 2421 Lillington Ct
- 463 Williamston Dr
- 481 Williamston Dr
- 477 Williamston Dr
- 459 Williamston Dr
- 487 Williamston Dr
- 473 Williamston Dr
- 2425 Lillington Ct
- 494 Williamston Dr
- 491 Williamston Dr
- 453 Williamston Dr
- 2412 Lillington Ct
- 2404 Lillington Ct
- 482 Channel Dr
- 476 Channel Dr