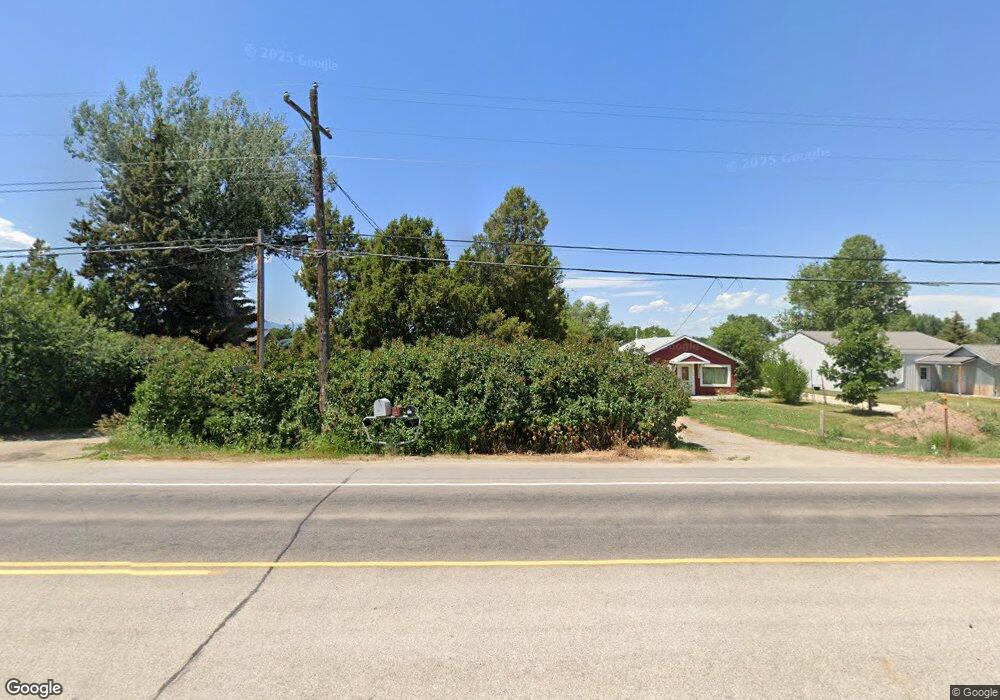
4700 Coffeen Ave Sheridan, WY 82801
Estimated Value: $406,000 - $456,925
3
Beds
1
Bath
1,306
Sq Ft
$328/Sq Ft
Est. Value
About This Home
This home is located at 4700 Coffeen Ave, Sheridan, WY 82801 and is currently estimated at $428,308, approximately $327 per square foot. 4700 Coffeen Ave is a home with nearby schools including Sheridan High School, Holy Name Catholic School, and Reaching Higher.
Ownership History
Date
Name
Owned For
Owner Type
Purchase Details
Closed on
Feb 12, 2015
Sold by
Tobester Properties Llc
Bought by
Tobi Steven A and Tobi Patricia K
Current Estimated Value
Purchase Details
Closed on
Apr 30, 2014
Sold by
Tobi Steven A and Tobi Patricia K
Bought by
Tobester Properties Llc
Purchase Details
Closed on
Dec 6, 2006
Sold by
Tobi Steven A and Tobi Patricia K
Bought by
Tobester Properties Llc
Home Financials for this Owner
Home Financials are based on the most recent Mortgage that was taken out on this home.
Original Mortgage
$153,750
Interest Rate
6.3%
Mortgage Type
New Conventional
Purchase Details
Closed on
Nov 30, 2006
Sold by
Barten Scott B and Barten Karen A
Bought by
Tobi Steven A and Tobi Patricia K
Home Financials for this Owner
Home Financials are based on the most recent Mortgage that was taken out on this home.
Original Mortgage
$153,750
Interest Rate
6.3%
Mortgage Type
New Conventional
Create a Home Valuation Report for This Property
The Home Valuation Report is an in-depth analysis detailing your home's value as well as a comparison with similar homes in the area
Home Values in the Area
Average Home Value in this Area
Purchase History
| Date | Buyer | Sale Price | Title Company |
|---|---|---|---|
| Tobi Steven A | -- | None Available | |
| Tobester Properties Llc | -- | None Available | |
| Tobester Properties Llc | -- | None Available | |
| Tobi Steven A | -- | None Available |
Source: Public Records
Mortgage History
| Date | Status | Borrower | Loan Amount |
|---|---|---|---|
| Previous Owner | Tobi Steven A | $153,750 |
Source: Public Records
Tax History Compared to Growth
Tax History
| Year | Tax Paid | Tax Assessment Tax Assessment Total Assessment is a certain percentage of the fair market value that is determined by local assessors to be the total taxable value of land and additions on the property. | Land | Improvement |
|---|---|---|---|---|
| 2025 | $2,067 | $23,972 | $6,715 | $17,257 |
| 2024 | $2,067 | $31,079 | $8,954 | $22,125 |
| 2023 | $2,082 | $31,305 | $8,202 | $23,103 |
| 2022 | $1,937 | $29,128 | $7,877 | $21,251 |
| 2021 | $1,669 | $25,099 | $7,782 | $17,317 |
| 2020 | $1,525 | $22,932 | $5,961 | $16,971 |
| 2019 | $1,400 | $21,049 | $5,506 | $15,543 |
| 2018 | $1,291 | $19,413 | $5,051 | $14,362 |
| 2017 | $1,277 | $19,205 | $5,051 | $14,154 |
| 2015 | $1,205 | $18,115 | $4,671 | $13,444 |
| 2014 | $1,177 | $17,704 | $4,006 | $13,698 |
| 2013 | -- | $17,028 | $4,006 | $13,022 |
Source: Public Records
Map
Nearby Homes
- 5 LOTS Creek Dr
- 476 Creek Cir
- 385 Hammer Creek Dr
- 1120 Fleming Blvd
- 1233 E Woodland Park Rd
- Lot 11 Bobcat Pass
- Lot 12 Bobcat Pass
- Lot 13 Bobcat Pass
- Lot 10 Bobcat Pass
- Lot 22 Bobcat Pass
- 1 Crystal Creek Dr
- Lot 20 Bobcat Pass
- Lot 9 Bobcat Pass
- Lot 19 Bobcat Pass
- 31 Mountain Brook Dr
- Lot 3 Bobcat Pass
- TBD College Meadow Dr
- Lot 4 Bobcat Pass
- 27 Home Ranch Cir
- 5901 Coffeen Ave Unit Lot 10
- 4690 Coffeen Ave
- 4718 Coffeen Ave
- 4672 Coffeen Ave
- 561 Brookie Path
- 579 Creek Dr
- 575 Creek Dr
- 565 Brookie Path
- 567 Brookie Path
- 560 Brookie Path
- 562 Brookie Path
- 564 Brookie Path
- 559 Brookie Path
- 566 Brookie Path
- 547 Minnow Path
- 543 Minnow Path
- 545 Minnow Path
- 4620 Coffeen Ave
- 557 Brookie Path
- 549 Minnow Path
- 542 Minnow Path