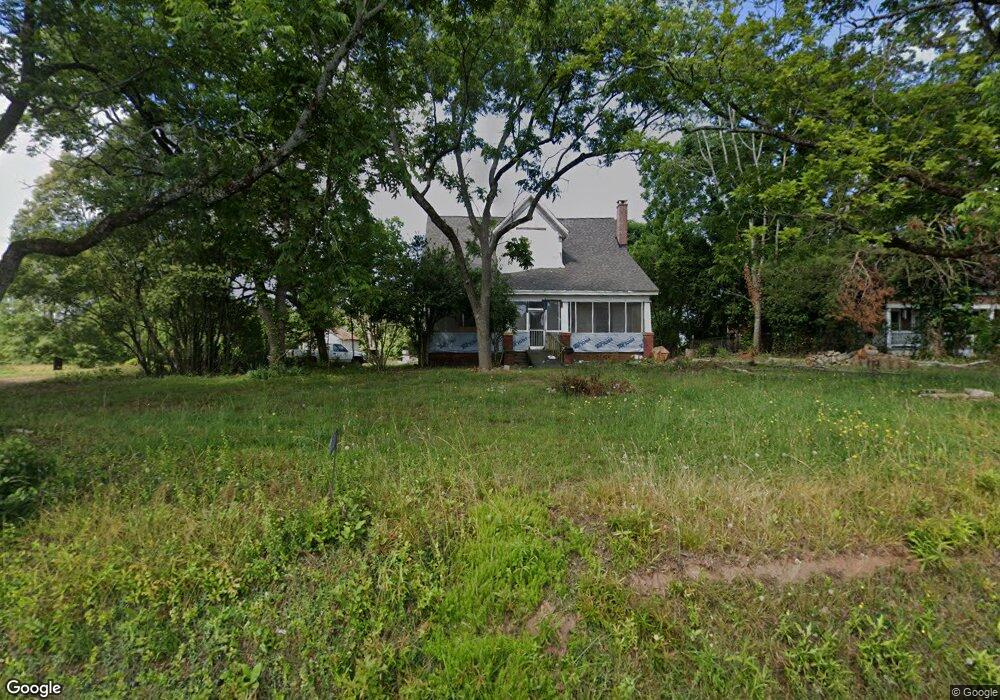
4700 Lower Apalachee Rd Madison, GA 30650
Estimated Value: $262,632 - $581,000
3
Beds
2
Baths
2,533
Sq Ft
$158/Sq Ft
Est. Value
About This Home
This home is located at 4700 Lower Apalachee Rd, Madison, GA 30650 and is currently estimated at $400,908, approximately $158 per square foot. 4700 Lower Apalachee Rd is a home located in Morgan County with nearby schools including Morgan County Primary School, Morgan County Elementary School, and Morgan County Middle School.
Ownership History
Date
Name
Owned For
Owner Type
Purchase Details
Closed on
Dec 19, 2022
Sold by
Murdock Megan Leah
Bought by
Ramirez Juan D
Current Estimated Value
Home Financials for this Owner
Home Financials are based on the most recent Mortgage that was taken out on this home.
Original Mortgage
$70,000
Interest Rate
6.61%
Mortgage Type
New Conventional
Purchase Details
Closed on
May 31, 2022
Sold by
Harrison Kenneth Lavaughn
Bought by
Murdock Megan
Purchase Details
Closed on
Dec 15, 2021
Sold by
Harrison Nina Childs
Bought by
Harrison Kenneth Lavaughn
Purchase Details
Closed on
Jun 21, 2007
Sold by
Harrison Nina Childs
Bought by
Harrison Nina Childs
Purchase Details
Closed on
Dec 9, 1998
Sold by
Childs Agnes
Bought by
Harrison Nina Childs
Purchase Details
Closed on
Jan 26, 1996
Sold by
Childs Agnes
Bought by
Childs Agnes
Purchase Details
Closed on
Aug 19, 1925
Sold by
Stovall J Frank
Bought by
Lomax J C
Create a Home Valuation Report for This Property
The Home Valuation Report is an in-depth analysis detailing your home's value as well as a comparison with similar homes in the area
Home Values in the Area
Average Home Value in this Area
Purchase History
| Date | Buyer | Sale Price | Title Company |
|---|---|---|---|
| Ramirez Juan D | $170,000 | -- | |
| Ramirez Juan D | -- | -- | |
| Murdock Megan | -- | -- | |
| Harrison Kenneth Lavaughn | -- | -- | |
| Harrison Nina Childs | -- | -- | |
| Harrison Nina Childs | -- | -- | |
| Childs Agnes | -- | -- | |
| Lomax J C | $2,500 | -- |
Source: Public Records
Mortgage History
| Date | Status | Borrower | Loan Amount |
|---|---|---|---|
| Previous Owner | Ramirez Juan D | $70,000 |
Source: Public Records
Tax History Compared to Growth
Tax History
| Year | Tax Paid | Tax Assessment Tax Assessment Total Assessment is a certain percentage of the fair market value that is determined by local assessors to be the total taxable value of land and additions on the property. | Land | Improvement |
|---|---|---|---|---|
| 2025 | $1,970 | $87,921 | $24,819 | $63,102 |
| 2024 | $1,662 | $72,962 | $20,682 | $52,280 |
| 2023 | $1,598 | $73,058 | $18,253 | $54,805 |
| 2022 | $1,598 | $65,314 | $12,168 | $53,146 |
| 2021 | $1,106 | $62,438 | $9,292 | $53,146 |
| 2020 | $1,116 | $62,438 | $9,292 | $53,146 |
| 2019 | $1,135 | $62,438 | $9,292 | $53,146 |
| 2018 | $986 | $55,974 | $9,292 | $46,682 |
| 2017 | $1,492 | $57,586 | $9,292 | $48,294 |
| 2016 | $967 | $53,995 | $9,200 | $44,795 |
| 2015 | $890 | $50,724 | $6,200 | $44,524 |
| 2014 | $411 | $33,652 | $5,600 | $28,052 |
| 2013 | -- | $26,728 | $5,600 | $21,128 |
Source: Public Records
Map
Nearby Homes
- 4550 Lower Apalachee Rd
- 1101 Shockley Rd
- 1211 Parsonage Rd
- 4410 Lower Apalachee Rd
- 0 Plantation Rd Unit 10449710
- 0 Plantation Rd Unit 22512873
- 0 Plantation Rd Unit 10449769
- 0 Plantation Rd Unit 22512874
- 1111 Pintail Ln
- 1700 Beaver Dam Rd
- 1560 Beaver Dam Rd
- 2911 A Sandy Creek Rd
- LOT 24 Apalachee Rd
- 1620 Tappan Spur Rd
- 0 Creekview Dr Unit 68833
- 0 Creekview Dr Unit 68831
- 0 Creekview Dr Unit 69800
- 0 Creekview Dr Unit 10545628
- 0 Creekview Dr Unit 10545636
- 1081 Apalachee Ridge
- 4720 Lower Apalachee Rd
- 4750 Lower Apalachee Rd
- 4670 Lower Apalachee Rd
- 4681 Lower Apalachee Rd
- 4675 Lower Apalachee Rd
- 1861 Plantation Rd
- 4762 Lower Apalachee Rd
- 1730 Plantation Rd
- 4810 Lower Apalachee Rd
- 4761 Lower Apalachee Rd
- 1061 Parsonage Rd
- 4611 Lower Apalachee Rd
- 4560 Lower Apalachee Rd
- 1760 Plantation Rd
- 1081 Parsonage Rd
- 1700 Plantation Rd
- 4880 Lower Apalachee Rd
- 1750 Plantation Rd
- 1720 Plantation Rd
- 1610 Plantation Rd