Estimated Value: $433,632 - $527,000
4
Beds
4
Baths
3,064
Sq Ft
$153/Sq Ft
Est. Value
About This Home
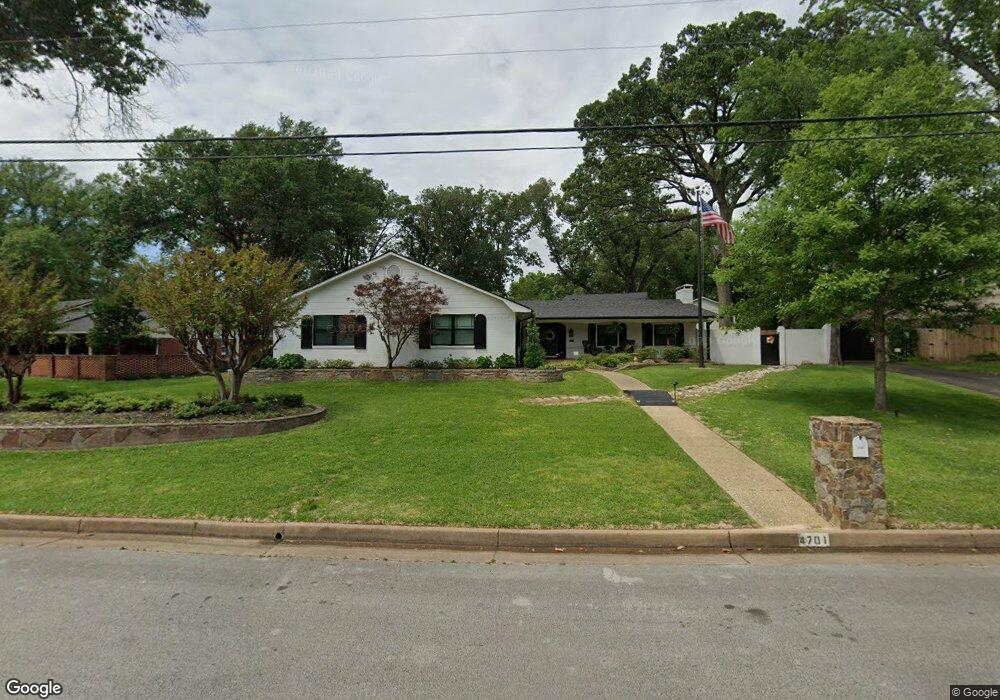
This home is located at 4701 4701 Richmond Rd, Tyler, TX 75703 and is currently estimated at $469,408, approximately $153 per square foot. 4701 4701 Richmond Rd is a home located in Smith County with nearby schools including Rice Elementary School, Hubbard Middle School, and Tyler Legacy High School.
Ownership History
Date
Name
Owned For
Owner Type
Purchase Details
Closed on
Sep 15, 2016
Sold by
Nash Todd and Nash Mishalene Dlynn
Bought by
Lamb Richard and Tyler Shayla
Current Estimated Value
Home Financials for this Owner
Home Financials are based on the most recent Mortgage that was taken out on this home.
Original Mortgage
$229,500
Outstanding Balance
$183,316
Interest Rate
3.43%
Mortgage Type
VA
Estimated Equity
$286,092
Purchase Details
Closed on
Jun 29, 2012
Sold by
Brock Jason Adam and Brock Tammy
Bought by
Nash Todd and Fnash Mishalene Dlynn
Home Financials for this Owner
Home Financials are based on the most recent Mortgage that was taken out on this home.
Original Mortgage
$236,250
Interest Rate
3.8%
Mortgage Type
Balloon
Create a Home Valuation Report for This Property
The Home Valuation Report is an in-depth analysis detailing your home's value as well as a comparison with similar homes in the area
Home Values in the Area
Average Home Value in this Area
Purchase History
| Date | Buyer | Sale Price | Title Company |
|---|---|---|---|
| Lamb Richard | -- | None Available | |
| Nash Todd | -- | None Available |
Source: Public Records
Mortgage History
| Date | Status | Borrower | Loan Amount |
|---|---|---|---|
| Open | Lamb Richard | $229,500 | |
| Previous Owner | Nash Todd | $236,250 |
Source: Public Records
Tax History Compared to Growth
Tax History
| Year | Tax Paid | Tax Assessment Tax Assessment Total Assessment is a certain percentage of the fair market value that is determined by local assessors to be the total taxable value of land and additions on the property. | Land | Improvement |
|---|---|---|---|---|
| 2024 | $7,589 | $435,347 | $67,360 | $367,987 |
| 2023 | $6,963 | $407,681 | $67,360 | $340,321 |
| 2022 | $6,963 | $355,422 | $61,887 | $293,535 |
| 2021 | $6,108 | $291,109 | $61,887 | $229,222 |
| 2020 | $5,959 | $278,474 | $61,887 | $216,587 |
| 2019 | $5,360 | $245,137 | $42,100 | $203,037 |
| 2018 | $5,258 | $241,761 | $42,100 | $199,661 |
| 2017 | $5,468 | $256,103 | $42,100 | $214,003 |
| 2016 | $5,761 | $269,850 | $42,100 | $227,750 |
| 2015 | $5,405 | $261,049 | $42,100 | $218,949 |
| 2014 | $5,405 | $254,339 | $42,100 | $212,239 |
Source: Public Records
Map
Nearby Homes
- 418 Boyd Ln
- 7434 Waterview Square
- 6052 N Park Central Ct
- 429 Holiday Ln
- 601 Carriage Dr
- 704 Paloma St
- 5106 Cloverdale Dr
- 11948 Gillian Ct
- 14237 County Road 192
- 14195 County Road 192
- 14245 County Road 192
- 802 Carriage Dr
- 842 Carriage Dr
- 608 Top Hill Dr
- 410 Brighton Ct
- 709 Top Hill Dr
- 504 Woodland Hills Dr
- 604-606 Woodland Hills Dr
- 717 Meadow Creek Dr
- 301 Atlanta Ave
- 4701 Richmond Rd
- 4711 Richmond Rd
- 4621 Richmond Rd
- 4710 Richmond Rd
- 4700 Richmond Rd
- 611 Timberwilde Dr
- 4720 Richmond Rd
- 4611 Richmond Rd
- 4801 Richmond Rd
- 612 612 Timberwilde Dr
- 612 Timberwilde Dr
- 511 Timberwilde Dr
- 4625 Leisure Ln
- 610 Dorchester Dr
- 615 Timberwilde Dr
- 4621 Leisure Ln
- 4610 Richmond Rd
- 618 618 Timberwilde
- 501 501 Timberwilde Dr
- 600 600 Dorchester