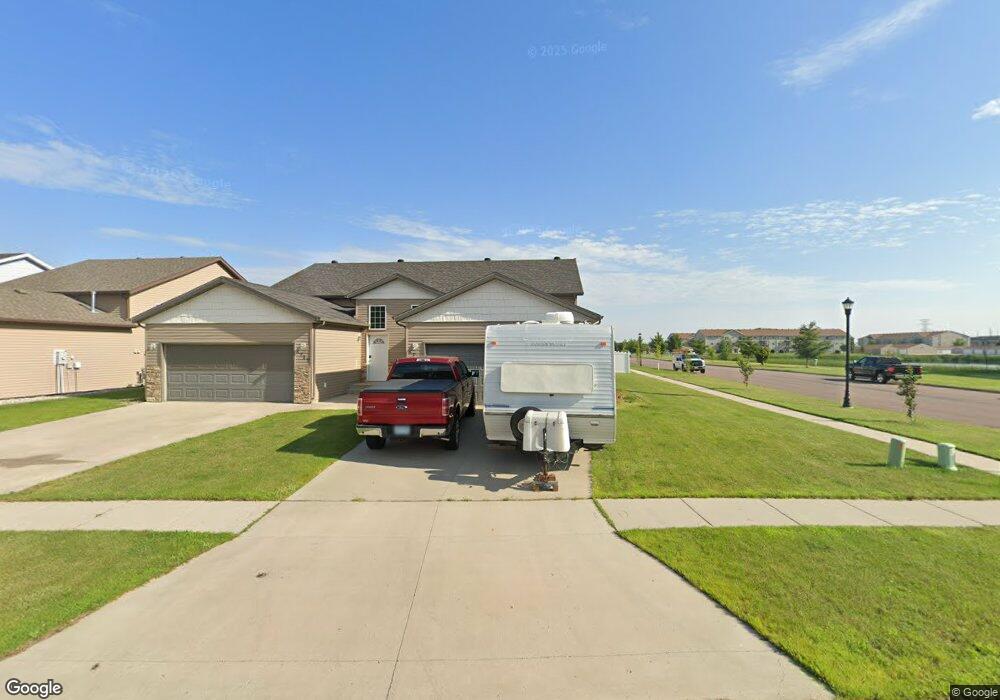
4701 Spencer Ln S Fargo, ND 58104
Brandt Crossing NeighborhoodEstimated Value: $312,314 - $321,000
4
Beds
2
Baths
2,186
Sq Ft
$146/Sq Ft
Est. Value
About This Home
This home is located at 4701 Spencer Ln S, Fargo, ND 58104 and is currently estimated at $318,079, approximately $145 per square foot. 4701 Spencer Ln S is a home located in Cass County with nearby schools including Liberty Middle School, West Fargo Sheyenne High School, and Trinity Elementary School.
Ownership History
Date
Name
Owned For
Owner Type
Purchase Details
Closed on
Jan 13, 2021
Sold by
Mortensen Carla and Mortensen Brian
Bought by
Wong Marissa and Wong Steve
Current Estimated Value
Home Financials for this Owner
Home Financials are based on the most recent Mortgage that was taken out on this home.
Original Mortgage
$142,000
Outstanding Balance
$126,735
Interest Rate
2.71%
Mortgage Type
New Conventional
Estimated Equity
$191,344
Purchase Details
Closed on
Jun 29, 2017
Sold by
Korth Nicholas and Korth Amanda
Bought by
Mortensen Brian and Mortensen Carla
Purchase Details
Closed on
Nov 15, 2012
Sold by
Thomsen Homes Llc
Bought by
Korth Nicholas and Korth Amanda
Home Financials for this Owner
Home Financials are based on the most recent Mortgage that was taken out on this home.
Original Mortgage
$149,425
Interest Rate
3.32%
Mortgage Type
New Conventional
Purchase Details
Closed on
Aug 14, 2012
Sold by
Brandt Crossing Llc
Bought by
Thomsen Homes Llc
Create a Home Valuation Report for This Property
The Home Valuation Report is an in-depth analysis detailing your home's value as well as a comparison with similar homes in the area
Home Values in the Area
Average Home Value in this Area
Purchase History
| Date | Buyer | Sale Price | Title Company |
|---|---|---|---|
| Wong Marissa | $225,000 | The Title Co Residential | |
| Mortensen Brian | $205,000 | Title Co | |
| Korth Nicholas | $157,290 | None Available | |
| Thomsen Homes Llc | -- | None Available |
Source: Public Records
Mortgage History
| Date | Status | Borrower | Loan Amount |
|---|---|---|---|
| Open | Wong Marissa | $142,000 | |
| Previous Owner | Korth Nicholas | $149,425 |
Source: Public Records
Tax History Compared to Growth
Tax History
| Year | Tax Paid | Tax Assessment Tax Assessment Total Assessment is a certain percentage of the fair market value that is determined by local assessors to be the total taxable value of land and additions on the property. | Land | Improvement |
|---|---|---|---|---|
| 2024 | $4,583 | $137,700 | $20,600 | $117,100 |
| 2023 | $4,806 | $127,750 | $18,000 | $109,750 |
| 2022 | $4,646 | $116,150 | $18,000 | $98,150 |
| 2021 | $4,676 | $116,150 | $18,000 | $98,150 |
| 2020 | $4,619 | $116,150 | $18,000 | $98,150 |
| 2019 | $4,585 | $116,150 | $10,000 | $106,150 |
| 2018 | $4,530 | $116,150 | $10,000 | $106,150 |
| 2017 | $4,211 | $110,850 | $10,000 | $100,850 |
| 2016 | $3,723 | $96,400 | $10,000 | $86,400 |
| 2015 | $3,731 | $96,400 | $7,500 | $88,900 |
| 2014 | $1,828 | $88,250 | $7,500 | $80,750 |
| 2013 | $1,528 | $8,050 | $7,500 | $550 |
Source: Public Records
Map
Nearby Homes
- 4767 Spencer Ln S
- 3606 Decorah Way S
- 4801 Decorah Way S
- 3624 Decorah Way
- 4849 Decorah Way S
- 1665 3-Stall Plan at The Residence at Valley View Estates
- 2191 2-Story 3-Stall Plan at The Residence at Valley View Estates
- 4918 35th Ave S
- 4822 34th Ave S
- 3617 49th St S
- 4941 Chelsea Ln S
- 3511 50th St S
- 4964 Big Goose Ln S
- 3527 Lincoln St S
- 3505 Lincoln St S
- 4996 37th Ave S
- 3548 Buchanan St S
- 4717 Spencer Ln S
- 4735 Spencer Ln S
- 4751 Spencer Ln S
- 4706 35th Ave S
- 4722 35th Ave S
- 4740 35th Ave S
- 4740 35 1/2 Court Ave S
- 4740 35th Ave S
- 4756 35th Ave S
- 4783 Spencer Ln S
- 4772 35th Ave S
- 4724 Spencer Ln S
- 4744 Spencer Ln S
- 4790 35th Ave S
- 4790 35th Ave S
- 4807 Spencer Ln S
- 4760 Spencer Ln S
- 4776 Spencer Ln S
- 4808 35th Ave S
- 3548 47th St S