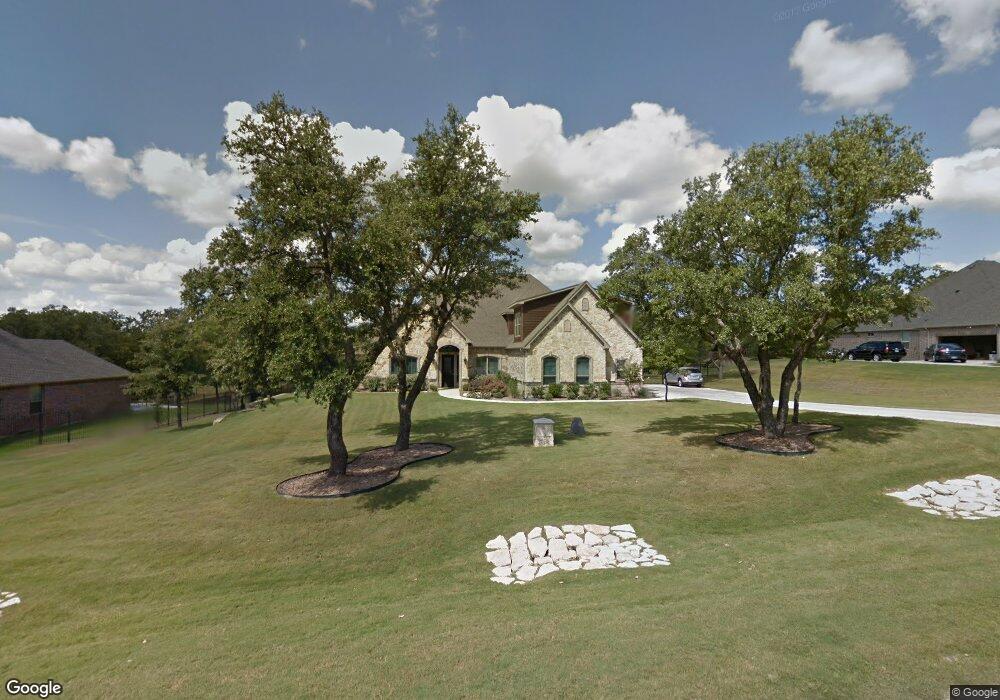
4701 Yucca Flats Trail Fort Worth, TX 76108
Estimated Value: $778,922 - $937,000
3
Beds
4
Baths
3,594
Sq Ft
$240/Sq Ft
Est. Value
About This Home
This home is located at 4701 Yucca Flats Trail, Fort Worth, TX 76108 and is currently estimated at $862,731, approximately $240 per square foot. 4701 Yucca Flats Trail is a home with nearby schools including Eagle Heights Elementary School, Azle Elementary School, and Azle Junior High School.
Ownership History
Date
Name
Owned For
Owner Type
Purchase Details
Closed on
Dec 2, 2011
Sold by
Venado Ridge Investments Llc
Bought by
Rinderknecht Ronny W and Rinderknecht Susan
Current Estimated Value
Home Financials for this Owner
Home Financials are based on the most recent Mortgage that was taken out on this home.
Original Mortgage
$250,000
Outstanding Balance
$27,228
Interest Rate
4.13%
Mortgage Type
Purchase Money Mortgage
Estimated Equity
$835,503
Purchase Details
Closed on
May 5, 2011
Sold by
Orilla Lane Partners Ltd
Bought by
Venado Ridge Investments Llc
Home Financials for this Owner
Home Financials are based on the most recent Mortgage that was taken out on this home.
Original Mortgage
$344,250
Interest Rate
4.86%
Mortgage Type
Construction
Create a Home Valuation Report for This Property
The Home Valuation Report is an in-depth analysis detailing your home's value as well as a comparison with similar homes in the area
Home Values in the Area
Average Home Value in this Area
Purchase History
| Date | Buyer | Sale Price | Title Company |
|---|---|---|---|
| Rinderknecht Ronny W | $382,630 | None Available | |
| Venado Ridge Investments Llc | -- | Hftc |
Source: Public Records
Mortgage History
| Date | Status | Borrower | Loan Amount |
|---|---|---|---|
| Open | Rinderknecht Ronny W | $250,000 | |
| Previous Owner | Venado Ridge Investments Llc | $344,250 |
Source: Public Records
Tax History Compared to Growth
Tax History
| Year | Tax Paid | Tax Assessment Tax Assessment Total Assessment is a certain percentage of the fair market value that is determined by local assessors to be the total taxable value of land and additions on the property. | Land | Improvement |
|---|---|---|---|---|
| 2025 | $4,286 | $717,621 | $150,674 | $566,947 |
| 2024 | $4,286 | $717,621 | $150,674 | $566,947 |
| 2023 | $10,574 | $780,021 | $150,674 | $629,347 |
| 2022 | $11,233 | $642,067 | $90,673 | $551,394 |
| 2021 | $10,479 | $576,624 | $90,000 | $486,624 |
| 2020 | $9,526 | $496,699 | $90,000 | $406,699 |
| 2019 | $9,603 | $478,695 | $60,000 | $418,695 |
| 2018 | $7,031 | $520,041 | $60,000 | $460,041 |
| 2017 | $9,080 | $475,508 | $60,000 | $415,508 |
| 2016 | $8,504 | $445,300 | $60,000 | $385,300 |
| 2015 | $6,841 | $418,200 | $58,000 | $360,200 |
| 2014 | $6,841 | $418,200 | $58,000 | $360,200 |
Source: Public Records
Map
Nearby Homes
- 7212 La Cantera Dr
- 4401 La Cantera Ct
- 5209 Arbor Mill Dr
- 6009 Feather Wind Way
- 5965 Feather Wind Way
- 4549 Rancho Blanca Ct
- 3001 Bald Eagle Ct
- 232 Copperwood Dr
- 4224 Estancia Way
- 5946 Feather Wind Way
- 10513 Silver Fox Ct
- 6636 Spanish Trail
- 10500 Estancia Ct
- 7442 Cottonwood Creek Rd
- 120 Ashley Ln
- 204 Cacti Dr
- 5944 Tenderfoot Trail
- 6942 Silver Creek Azle Rd
- 742 Boling Ranch Rd
- 6916 9 Mile Azle Rd Unit 15
- 4647 Yucca Flats Trail
- 4713 Yucca Flats Trail
- 4633 Yucca Flats Trail
- 4725 Yucca Flats Trail
- 7736 La Cantera Dr
- 4646 Yucca Flats Rd
- 4632 Yucca Flats Rd
- 7724 La Cantera Dr
- 4625 Yucca Flats Trail
- 7549 Confederate Park Rd
- 4624 Yucca Flats Rd
- 4613 Yucca Flats Trail
- 4645 Terlingua Ct
- 4612 Yucca Flats Rd
- 4633 Terlingua Ct
- 7700 La Cantera Dr
- 4601 Yucca Flats Trail
- 7601 Confederate Park Rd
- 4621 Terlingua Ct
- 4600 Yucca Flats Rd