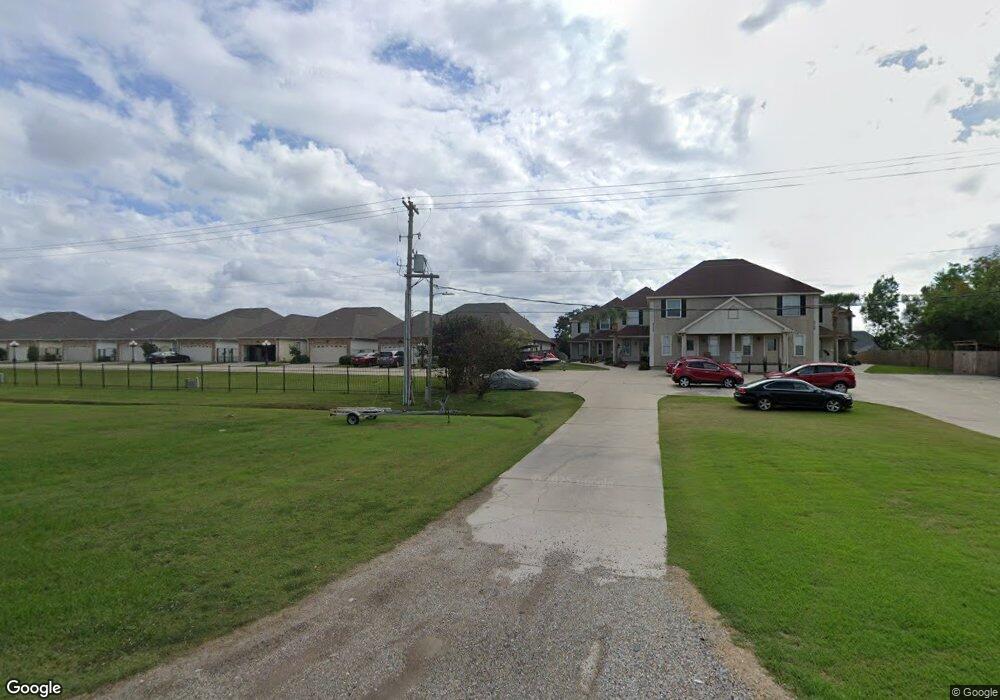
4702 Pontchartrain Dr Unit 8 Slidell, LA 70458
Estimated Value: $133,000 - $185,000
Studio
--
Bath
1,200
Sq Ft
$131/Sq Ft
Est. Value
About This Home
This home is located at 4702 Pontchartrain Dr Unit 8, Slidell, LA 70458 and is currently estimated at $156,938, approximately $130 per square foot. 4702 Pontchartrain Dr Unit 8 is a home located in St. Tammany Parish with nearby schools including W.L. Abney Elementary School, St. Tammany Junior High School, and Salmen High School.
Ownership History
Date
Name
Owned For
Owner Type
Purchase Details
Closed on
Aug 1, 2019
Sold by
Parkland Inc
Bought by
Saltalamacchia Anthony J and Saltalamacchia Diane Hyman
Current Estimated Value
Purchase Details
Closed on
May 24, 2017
Sold by
Favre Cody
Bought by
Thigpen John M
Home Financials for this Owner
Home Financials are based on the most recent Mortgage that was taken out on this home.
Original Mortgage
$96,000
Interest Rate
4.03%
Mortgage Type
New Conventional
Purchase Details
Closed on
Jun 18, 2013
Sold by
Malone Christine M and Malone Timothy K
Bought by
Favre Cody R
Home Financials for this Owner
Home Financials are based on the most recent Mortgage that was taken out on this home.
Original Mortgage
$56,500
Interest Rate
3.63%
Mortgage Type
New Conventional
Purchase Details
Closed on
Apr 21, 2010
Sold by
Encarnacion Corazon Gonzales and Encarnacion Jose M
Bought by
Be Phh Mortgage Corp
Create a Home Valuation Report for This Property
The Home Valuation Report is an in-depth analysis detailing your home's value as well as a comparison with similar homes in the area
Home Values in the Area
Average Home Value in this Area
Purchase History
| Date | Buyer | Sale Price | Title Company |
|---|---|---|---|
| Saltalamacchia Anthony J | $125,000 | Allegiance Title | |
| Thigpen John M | $120,000 | First American Title | |
| Favre Cody R | $116,500 | Multiple | |
| Be Phh Mortgage Corp | $105,000 | None Available |
Source: Public Records
Mortgage History
| Date | Status | Borrower | Loan Amount |
|---|---|---|---|
| Previous Owner | Thigpen John M | $96,000 | |
| Previous Owner | Favre Cody R | $56,500 |
Source: Public Records
Tax History
| Year | Tax Paid | Tax Assessment Tax Assessment Total Assessment is a certain percentage of the fair market value that is determined by local assessors to be the total taxable value of land and additions on the property. | Land | Improvement |
|---|---|---|---|---|
| 2025 | $1,770 | $13,779 | $315 | $13,464 |
| 2024 | $1,770 | $13,779 | $315 | $13,464 |
| 2023 | $1,841 | $9,489 | $315 | $9,174 |
| 2022 | $141,171 | $9,489 | $315 | $9,174 |
| 2021 | $1,410 | $9,489 | $315 | $9,174 |
| 2020 | $1,403 | $9,489 | $315 | $9,174 |
| 2019 | $1,616 | $10,571 | $315 | $10,256 |
| 2018 | $1,622 | $10,571 | $315 | $10,256 |
| 2017 | $1,632 | $10,571 | $315 | $10,256 |
| 2016 | $1,669 | $10,571 | $315 | $10,256 |
| 2015 | $705 | $11,698 | $1,800 | $9,898 |
| 2014 | $692 | $11,698 | $1,800 | $9,898 |
| 2013 | -- | $11,698 | $1,800 | $9,898 |
Source: Public Records
Map
Nearby Homes
- 4702 Pontchartrain Dr Unit B
- 4702 Pontchartrain Dr Unit A
- 4700 Pontchartrain Dr Unit B
- 4700 Pontchartrain Dr Unit A
- 4702 Pontchartrain Dr Unit 5
- 4817 Pontchartrain Dr
- 4774 Pontchartrain Dr Unit 52
- 4774 Pontchartrain Dr
- 4813 Pontchartrain Dr
- 0 Pontchartrain #2 Dr Unit 2293433
- 4780 Pontchartrain Dr Unit 109
- 4780 Pontchartrain Dr Unit 102
- 4780 Pontchartrain Dr Unit 103
- 4780 Pontchartrain Dr Unit 104
- 4780 Pontchartrain Dr Unit 105
- 4780 Pontchartrain Dr Unit 108
- 4780 Pontchartrain Dr Unit 110
- 4780 Pontchartrain Dr Unit 111
- 4780 Pontchartrain Dr Unit 112
- 4780 Pontchartrain Dr Unit 13
Your Personal Tour Guide
Ask me questions while you tour the home.