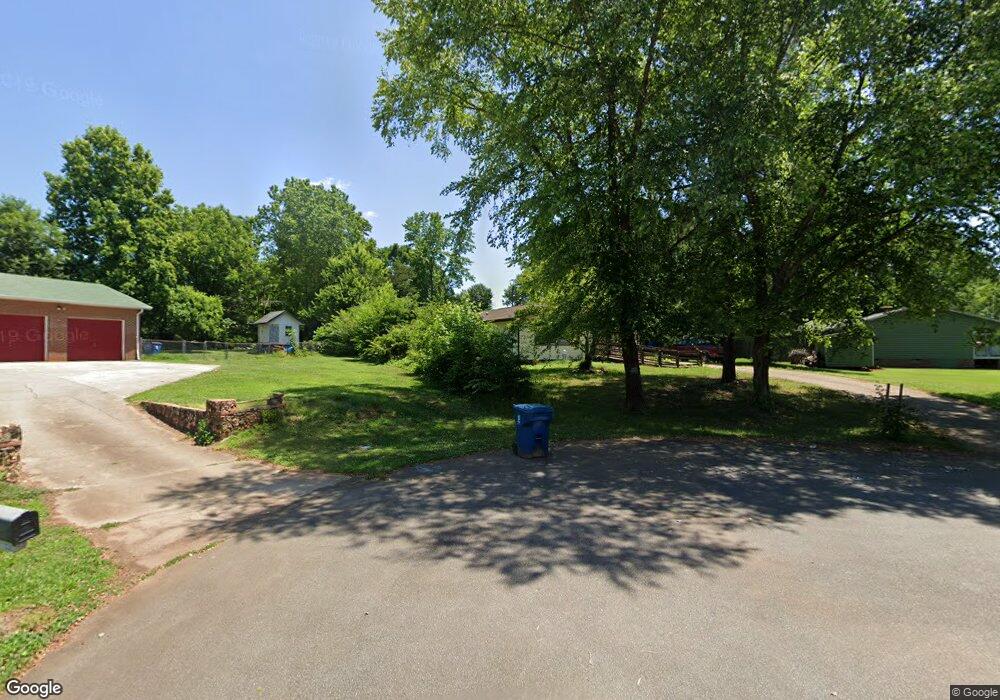
4702 Queens Rd Hickory, NC 28602
Estimated Value: $229,000 - $299,000
3
Beds
1
Bath
1,426
Sq Ft
$181/Sq Ft
Est. Value
About This Home
This home is located at 4702 Queens Rd, Hickory, NC 28602 and is currently estimated at $258,193, approximately $181 per square foot. 4702 Queens Rd is a home located in Catawba County with nearby schools including Fred T. Foard High School, Blackburn Elementary School, and Jacobs Fork Middle School.
Ownership History
Date
Name
Owned For
Owner Type
Purchase Details
Closed on
Aug 28, 2024
Sold by
Asbury Kelley Joann and Harvill Kelley Joann
Bought by
Jones Timothy L and Jones Johanna Lynn
Current Estimated Value
Home Financials for this Owner
Home Financials are based on the most recent Mortgage that was taken out on this home.
Original Mortgage
$168,000
Outstanding Balance
$166,216
Interest Rate
6.77%
Mortgage Type
New Conventional
Estimated Equity
$91,977
Purchase Details
Closed on
Feb 27, 2014
Sold by
Brendel Charles L
Bought by
Jackson Gwendolyn Deal and Asbury Kelley Joann
Purchase Details
Closed on
Mar 6, 1984
Sold by
Brindel Charles L + Irene T
Bought by
Brindel Charles L
Purchase Details
Closed on
Jan 17, 1983
Purchase Details
Closed on
May 13, 1980
Purchase Details
Closed on
Oct 24, 1978
Purchase Details
Closed on
Jan 5, 1978
Purchase Details
Closed on
Dec 1, 1976
Purchase Details
Closed on
Apr 2, 1974
Create a Home Valuation Report for This Property
The Home Valuation Report is an in-depth analysis detailing your home's value as well as a comparison with similar homes in the area
Home Values in the Area
Average Home Value in this Area
Purchase History
| Date | Buyer | Sale Price | Title Company |
|---|---|---|---|
| Jones Timothy L | $210,000 | Investors Title | |
| Jackson Gwendolyn Deal | -- | None Available | |
| Brindel Charles L | -- | -- | |
| -- | -- | -- | |
| -- | -- | -- | |
| -- | -- | -- | |
| -- | -- | -- | |
| -- | -- | -- | |
| -- | -- | -- |
Source: Public Records
Mortgage History
| Date | Status | Borrower | Loan Amount |
|---|---|---|---|
| Open | Jones Timothy L | $168,000 |
Source: Public Records
Tax History
| Year | Tax Paid | Tax Assessment Tax Assessment Total Assessment is a certain percentage of the fair market value that is determined by local assessors to be the total taxable value of land and additions on the property. | Land | Improvement |
|---|---|---|---|---|
| 2025 | $977 | $205,300 | $13,900 | $191,400 |
| 2024 | $977 | $201,900 | $13,900 | $188,000 |
| 2023 | $952 | $201,900 | $13,900 | $188,000 |
| 2022 | $714 | $107,300 | $13,900 | $93,400 |
| 2021 | $694 | $107,300 | $13,900 | $93,400 |
| 2020 | $694 | $107,300 | $0 | $0 |
| 2019 | $694 | $107,300 | $0 | $0 |
| 2018 | $584 | $89,900 | $13,900 | $76,000 |
| 2017 | $0 | $0 | $0 | $0 |
| 2016 | $571 | $0 | $0 | $0 |
| 2015 | $549 | $89,850 | $13,900 | $75,950 |
| 2014 | $549 | $93,000 | $11,200 | $81,800 |
Source: Public Records
Map
Nearby Homes
- 1418 Mammoth Rd
- 1447 Mammoth Rd
- 1457 Avila St
- 1431 Mammoth Rd
- 1453 Avila St
- 4640 Fanning Rd
- 1430 Mammoth Rd
- 1414 Mammoth Rd
- 1743 Whitewater Ct
- 1410 Mammoth Rd
- 1406 Mammoth Rd
- 5050 Orchard Park Dr
- 4980 Forest Ridge Dr
- 1450 Jc Raulston Ct
- 5118 Regents Park Dr
- 2026 Talbot Ln
- 4932 Southview Dr
- 4940 Southview Dr
- 1360 Sain Rd
- 2010 Elizabeth Ave
- 4702 Queens Rd Unit 60
- 4670 Queens Rd
- 4710 Queens Rd
- 4652 Queens Rd
- 1397 Prince St
- 1403 Prince St
- 1383 Prince St
- 1371 Prince St
- 1415 Prince St
- 1415 Prince St Unit 57
- 4703 Queens Rd
- 4711 Queens Rd
- 1359 Prince St
- 4695 Queens Rd
- 4657 Queens Rd
- 4669 Queens Rd
- 1349 Prince St
- 4685 Queens Rd
- 4677 Queens Rd
- 1388 Prince St
Your Personal Tour Guide
Ask me questions while you tour the home.