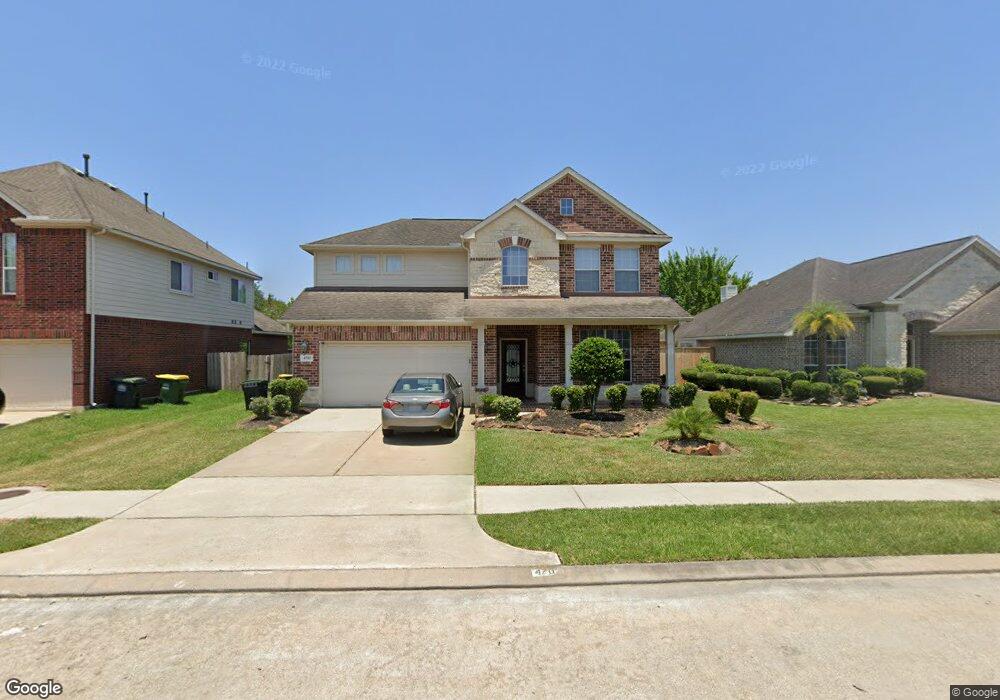
4703 Cypress Bend Ct Pearland, TX 77584
Estimated Value: $345,000 - $379,000
4
Beds
3
Baths
2,552
Sq Ft
$143/Sq Ft
Est. Value
About This Home
This home is located at 4703 Cypress Bend Ct, Pearland, TX 77584 and is currently estimated at $364,039, approximately $142 per square foot. 4703 Cypress Bend Ct is a home located in Brazoria County with nearby schools including C.J. Harris Elementary School, Pearland Junior High School East, and Alexander Middle School.
Ownership History
Date
Name
Owned For
Owner Type
Purchase Details
Closed on
Jul 8, 2016
Sold by
Hart Jerry L and Hart Laura
Bought by
Obayuwana Vincent O
Current Estimated Value
Home Financials for this Owner
Home Financials are based on the most recent Mortgage that was taken out on this home.
Original Mortgage
$205,500
Outstanding Balance
$164,157
Interest Rate
3.6%
Mortgage Type
New Conventional
Estimated Equity
$199,882
Purchase Details
Closed on
May 15, 2006
Sold by
Hart Monica P
Bought by
Hart Jerry L
Purchase Details
Closed on
Jan 31, 2006
Sold by
Rah Of Texas Lp
Bought by
Hart Jerry L and Hart Monica P
Home Financials for this Owner
Home Financials are based on the most recent Mortgage that was taken out on this home.
Original Mortgage
$170,991
Interest Rate
6.24%
Mortgage Type
Fannie Mae Freddie Mac
Create a Home Valuation Report for This Property
The Home Valuation Report is an in-depth analysis detailing your home's value as well as a comparison with similar homes in the area
Home Values in the Area
Average Home Value in this Area
Purchase History
| Date | Buyer | Sale Price | Title Company |
|---|---|---|---|
| Obayuwana Vincent O | -- | Chicago Title | |
| Hart Jerry L | -- | None Available | |
| Hart Jerry L | -- | First American Title |
Source: Public Records
Mortgage History
| Date | Status | Borrower | Loan Amount |
|---|---|---|---|
| Open | Obayuwana Vincent O | $205,500 | |
| Previous Owner | Hart Jerry L | $170,991 |
Source: Public Records
Tax History Compared to Growth
Tax History
| Year | Tax Paid | Tax Assessment Tax Assessment Total Assessment is a certain percentage of the fair market value that is determined by local assessors to be the total taxable value of land and additions on the property. | Land | Improvement |
|---|---|---|---|---|
| 2025 | $6,913 | $338,860 | $22,770 | $316,090 |
| 2023 | $6,913 | $319,869 | $22,770 | $341,830 |
| 2022 | $7,868 | $290,790 | $22,770 | $268,020 |
| 2021 | $7,766 | $266,280 | $20,700 | $245,580 |
| 2020 | $7,590 | $249,180 | $20,700 | $228,480 |
| 2019 | $6,947 | $225,640 | $20,700 | $204,940 |
| 2018 | $6,803 | $221,810 | $20,700 | $201,110 |
| 2017 | $6,899 | $221,810 | $20,700 | $201,110 |
| 2016 | $6,457 | $207,610 | $20,700 | $186,910 |
| 2015 | $4,221 | $190,400 | $20,700 | $169,700 |
| 2014 | $4,221 | $178,070 | $20,700 | $157,370 |
Source: Public Records
Map
Nearby Homes
- 4615 W Walnut St
- 4609 Buescher Ct
- 4610 Meridian Park Dr
- 2721 Village Mills Dr
- 4304 Keystone Trail
- 4505 Cedar Hill Dr
- 2808 Tranquility Trail
- 4805 Campbell Dr
- 2317 Cedar St
- 2315 Cedar St
- 2321 Pearland Ave
- 5013 Camden Ln
- 5003 Apple Springs Dr
- 2913 Linda Dr
- 2312 Willow Blvd
- 2322 Francis Dr
- 2422-2436 S Main St
- 2245 N Austin Ave
- 2915 Veva Dr
- 2515 S Houston Ave
- 4705 Cypress Bend Ct
- 4701 Cypress Bend Ct
- 4706 Cypress Bend Ct
- 4702 Cypress Bend Ct
- 4709 Cypress Bend Ct
- 4708 Cypress Bend Ct
- 4710 Cypress Bend Ct
- 4611 Cypress Bend Ct
- 4711 Cypress Bend Ct
- 2546 S Austin Ave
- 4706 W Walnut St
- 4708 W Walnut St
- 4703 Sebastopol Dr
- 4705 Sebastopol Dr
- 4712 Cypress Bend Ct
- 4701 Sebastopol Dr
- 4608 Cypress Bend Ct
- 4707 Sebastopol Dr
- 2547 S Austin Ave
- 4609 Cypress Bend Ct