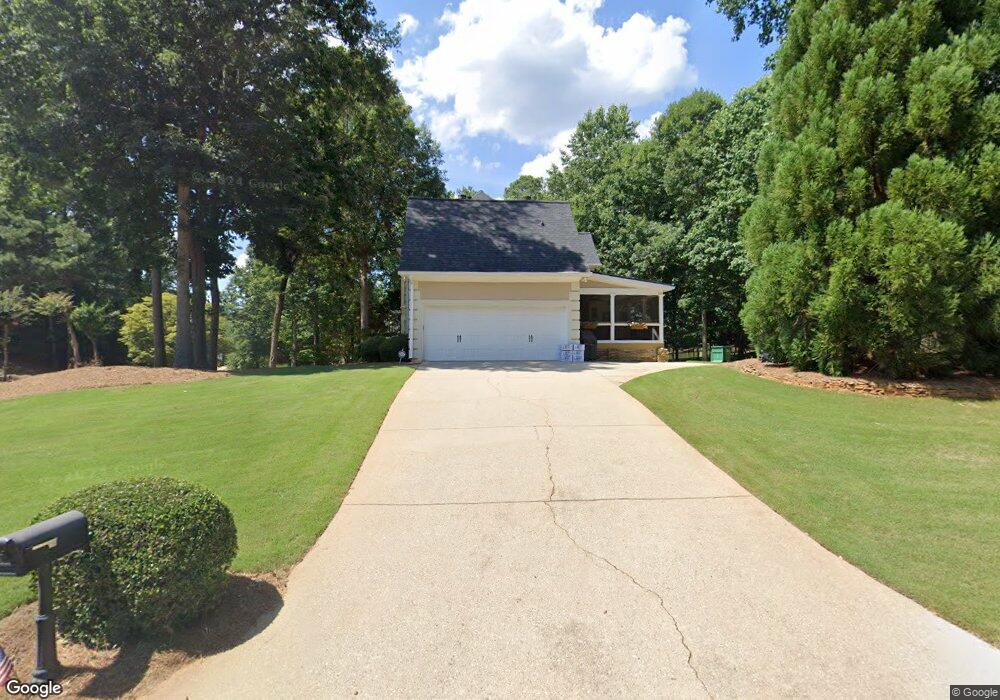
4703 Fitzpatrick Way Unit 2 Norcross, GA 30092
Estimated Value: $642,000 - $948,000
5
Beds
4
Baths
3,582
Sq Ft
$213/Sq Ft
Est. Value
About This Home
This home is located at 4703 Fitzpatrick Way Unit 2, Norcross, GA 30092 and is currently estimated at $763,818, approximately $213 per square foot. 4703 Fitzpatrick Way Unit 2 is a home located in Gwinnett County with nearby schools including Simpson Elementary School, Pinckneyville Middle School, and Norcross High School.
Ownership History
Date
Name
Owned For
Owner Type
Purchase Details
Closed on
Mar 27, 2015
Sold by
Bruce Janet H
Bought by
Bruce Frederick J
Current Estimated Value
Purchase Details
Closed on
Jun 6, 2005
Sold by
Bruce Frederick J
Bought by
Bruce Frederick J and Bruce Janet
Home Financials for this Owner
Home Financials are based on the most recent Mortgage that was taken out on this home.
Original Mortgage
$313,000
Interest Rate
5.69%
Mortgage Type
New Conventional
Purchase Details
Closed on
Oct 31, 2001
Sold by
Sett David B
Bought by
Sett David B
Home Financials for this Owner
Home Financials are based on the most recent Mortgage that was taken out on this home.
Original Mortgage
$253,000
Interest Rate
6.67%
Mortgage Type
New Conventional
Purchase Details
Closed on
Jun 29, 1998
Sold by
Ramsey Mickey K and Ramsey Deborah F
Bought by
Sett David B
Home Financials for this Owner
Home Financials are based on the most recent Mortgage that was taken out on this home.
Original Mortgage
$256,500
Interest Rate
7.02%
Mortgage Type
New Conventional
Create a Home Valuation Report for This Property
The Home Valuation Report is an in-depth analysis detailing your home's value as well as a comparison with similar homes in the area
Home Values in the Area
Average Home Value in this Area
Purchase History
| Date | Buyer | Sale Price | Title Company |
|---|---|---|---|
| Bruce Frederick J | -- | -- | |
| Bruce Frederick J | -- | -- | |
| Bruce Frederick J | $391,300 | -- | |
| Cendant Mobility Government Fina | $391,300 | -- | |
| Sett David B | -- | -- | |
| Sett David B | $285,000 | -- |
Source: Public Records
Mortgage History
| Date | Status | Borrower | Loan Amount |
|---|---|---|---|
| Previous Owner | Cendant Mobility Government Fina | $313,000 | |
| Previous Owner | Sett David B | $253,000 | |
| Previous Owner | Sett David B | $256,500 |
Source: Public Records
Tax History Compared to Growth
Tax History
| Year | Tax Paid | Tax Assessment Tax Assessment Total Assessment is a certain percentage of the fair market value that is determined by local assessors to be the total taxable value of land and additions on the property. | Land | Improvement |
|---|---|---|---|---|
| 2025 | $8,936 | $355,120 | $38,000 | $317,120 |
| 2024 | $7,136 | $248,000 | $50,000 | $198,000 |
| 2023 | $7,136 | $248,000 | $50,000 | $198,000 |
| 2022 | $6,699 | $226,240 | $42,000 | $184,240 |
| 2021 | $6,018 | $187,320 | $35,520 | $151,800 |
| 2020 | $6,060 | $187,320 | $35,520 | $151,800 |
| 2019 | $5,712 | $179,360 | $30,000 | $149,360 |
| 2018 | $5,733 | $179,360 | $30,000 | $149,360 |
| 2016 | $5,108 | $152,480 | $24,000 | $128,480 |
| 2015 | $5,165 | $152,480 | $24,000 | $128,480 |
| 2014 | -- | $129,608 | $20,400 | $109,208 |
Source: Public Records
Map
Nearby Homes
- 5863 Revington Dr
- 5465 Fort Fisher Way
- 5465 Fort Fisher Way
- 9005 Old Southwick Pass
- 4531 Outer Bank Dr
- 5545 Fitzpatrick Terrace
- 955 Tiverton Ln
- 8870 Glen Ferry Dr Unit 1
- 8800 Glen Ferry Dr
- 1285 Stuart Ridge
- 1055 Leadenhall St
- 5397 Valley Mist Ct
- 1050 Bedford Gardens Dr
- 0 Old Southwick Pass Unit 10646630
- 0 Old Southwick Pass Unit 7683754
- 0 Spyglass Bluff Unit 7666454
- 0 Spyglass Bluff Unit 10628282
- 8870 Old Southwick Pass
- 5221 W Jones Bridge Rd
- 6092 Carlisle Ln
- 4713 Fitzpatrick Way Unit 2
- 4693 Fitzpatrick Way
- 5633 Wilmer Dr
- 4723 Fitzpatrick Way
- 4782 Outer Bank Dr
- 4683 Fitzpatrick Way
- 4694 Fitzpatrick Way Unit 2
- 5643 Wilmer Dr Unit 5643
- 5643 Wilmer Dr
- 5643 Wilmer Dr Unit 2
- 0 Wilmer Dr Unit 7515958
- 0 Wilmer Dr Unit 7254765
- 0 Wilmer Dr Unit 8826474
- 0 Wilmer Dr Unit 3133789
- 4792 Outer Bank Dr
- 4724 Fitzpatrick Way
- 4724 Fitzpatrick Way Unit 5
- 4673 Fitzpatrick Way Unit 2
- 5653 Wilmer Dr
- 5644 Wilmer Dr