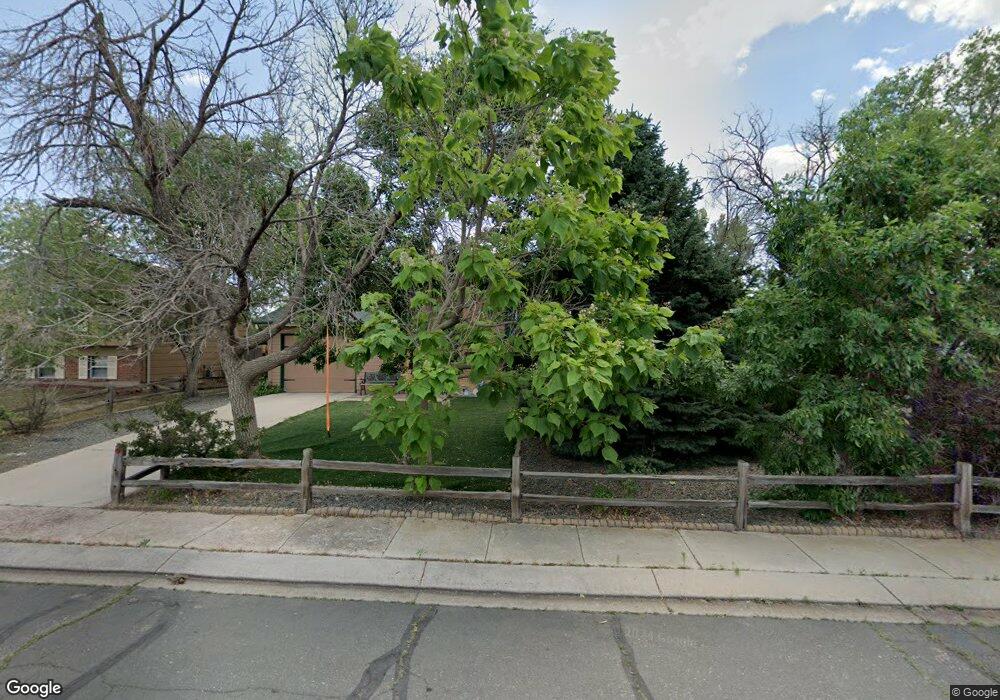
4703 Newton Dr Colorado Springs, CO 80916
Southborough NeighborhoodEstimated Value: $336,260 - $388,000
2
Beds
2
Baths
998
Sq Ft
$366/Sq Ft
Est. Value
About This Home
This home is located at 4703 Newton Dr, Colorado Springs, CO 80916 and is currently estimated at $365,065, approximately $365 per square foot. 4703 Newton Dr is a home located in El Paso County with nearby schools including Giberson Elementary School, Panorama Middle School, and Sierra High School.
Ownership History
Date
Name
Owned For
Owner Type
Purchase Details
Closed on
Jun 27, 2001
Sold by
Va
Bought by
Scott Russell
Current Estimated Value
Home Financials for this Owner
Home Financials are based on the most recent Mortgage that was taken out on this home.
Original Mortgage
$118,201
Outstanding Balance
$45,452
Interest Rate
7.11%
Mortgage Type
FHA
Estimated Equity
$319,613
Purchase Details
Closed on
Jan 4, 2001
Sold by
First Horizon Home Loans
Bought by
Va
Purchase Details
Closed on
Dec 27, 2000
Sold by
Burch Leslie J and Burch Kimberly S
Bought by
First Horizon Home Loans
Purchase Details
Closed on
Mar 28, 1997
Sold by
Brenner Alicia D
Bought by
Burch Leslie J and Burch Kimberly S
Home Financials for this Owner
Home Financials are based on the most recent Mortgage that was taken out on this home.
Original Mortgage
$99,950
Interest Rate
8.25%
Mortgage Type
VA
Purchase Details
Closed on
Sep 27, 1991
Bought by
Scott Russell
Purchase Details
Closed on
Sep 16, 1991
Bought by
Scott Russell
Create a Home Valuation Report for This Property
The Home Valuation Report is an in-depth analysis detailing your home's value as well as a comparison with similar homes in the area
Home Values in the Area
Average Home Value in this Area
Purchase History
| Date | Buyer | Sale Price | Title Company |
|---|---|---|---|
| Scott Russell | $120,057 | Security Title | |
| Va | -- | -- | |
| First Horizon Home Loans | $98,706 | -- | |
| Burch Leslie J | $98,000 | Stewart Title | |
| Scott Russell | $64,900 | -- | |
| Scott Russell | -- | -- | |
| Scott Russell | $61,800 | -- |
Source: Public Records
Mortgage History
| Date | Status | Borrower | Loan Amount |
|---|---|---|---|
| Open | Scott Russell | $118,201 | |
| Previous Owner | Burch Leslie J | $99,950 |
Source: Public Records
Tax History Compared to Growth
Tax History
| Year | Tax Paid | Tax Assessment Tax Assessment Total Assessment is a certain percentage of the fair market value that is determined by local assessors to be the total taxable value of land and additions on the property. | Land | Improvement |
|---|---|---|---|---|
| 2025 | $1,309 | $26,180 | -- | -- |
| 2024 | $1,026 | $26,280 | $3,580 | $22,700 |
| 2023 | $1,026 | $26,280 | $3,580 | $22,700 |
| 2022 | $1,030 | $19,090 | $3,130 | $15,960 |
| 2021 | $1,099 | $19,640 | $3,220 | $16,420 |
| 2020 | $985 | $15,120 | $2,500 | $12,620 |
| 2019 | $955 | $15,120 | $2,500 | $12,620 |
| 2018 | $776 | $11,820 | $1,800 | $10,020 |
| 2017 | $592 | $11,820 | $1,800 | $10,020 |
| 2016 | $624 | $11,690 | $1,830 | $9,860 |
| 2015 | $624 | $11,690 | $1,830 | $9,860 |
| 2014 | $589 | $10,900 | $1,830 | $9,070 |
Source: Public Records
Map
Nearby Homes
- 4770 Newton Dr
- 4806 Rusty Nail Point Unit 202
- 2922 Dickens Dr
- 4754 Painted Sky View
- 2785 Clarendon Dr
- 4598 Wordsworth Cir N
- 4520 Melville Dr
- 2655 Prescott Cir E
- 4470 Beaumont Rd
- 3059 Shikra View
- 2742 Dickens Dr
- 4535 Allison Dr
- 4410 Joyce Place
- 2535 Helton Ct
- 4820 Sea Eagle Dr
- 2625 Plymouth Dr
- 4801 Live Oak Dr
- 3265 Foxridge Dr
- 4475 London Ln
- 5054 Rusty Nail Point