
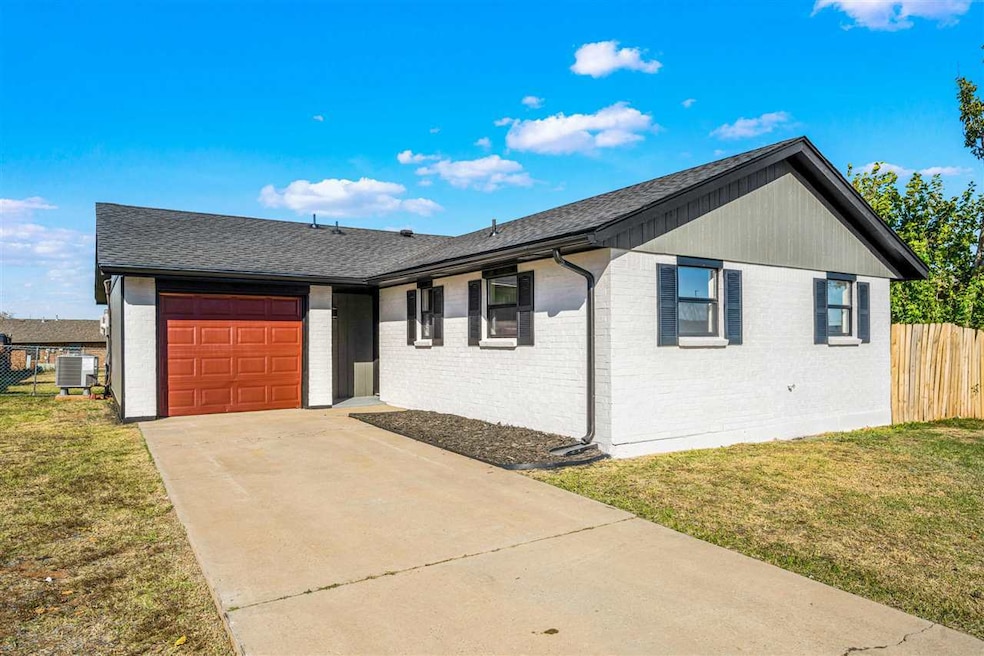


4703 SW K Cir Lawton, OK 73505
Country Club Heights NeighborhoodEstimated payment $873/month
Total Views
7,477
3
Beds
1.5
Baths
1,400
Sq Ft
$110
Price per Sq Ft
Highlights
- Open Floorplan
- Game Room
- Formal Dining Room
- Granite Countertops
- Covered Patio or Porch
- Double Pane Windows
About This Home
Beautiful remodel with everything you're looking for! BRAND NEW roof, HVAC system, windows, water heater, flooring, paint, kitchen, bathrooms, and so much more! This 3 bedroom, 1.5 bathroom house has an open concept living/dining/kitchen area, as well as a bonus space off the living room that could be a playroom, home gym, pet zone, office, extra dining space, or anything else you want it to be. The new sliding glass doors in that space lead out to the fenced backyard, complete with a patio for grilling or lounging. In the kitchen you'll find all-new stainless steel appliances (fridge, microwave, dishwasher, stove/oven, garbage disposal, vent hood), new cabinets, and granite countertops. The one-car garage has been spruced up with epoxy floor paint, and the whole house has fresh paint inside and out. If you're ready to make this place your own, contact your dedicated real estate agent or call/text 580-713-9494 to reach the listing agent.
Home Details
Home Type
- Single Family
Est. Annual Taxes
- $754
Year Built
- Built in 1984 | Remodeled
Lot Details
- Lot Dimensions are 60'x129'
- Wood Fence
- Chain Link Fence
Parking
- 1 Car Garage
Home Design
- Brick Veneer
- Slab Foundation
- Composition Roof
Interior Spaces
- 1,400 Sq Ft Home
- 1-Story Property
- Open Floorplan
- Ceiling Fan
- Double Pane Windows
- Formal Dining Room
- Game Room
- Utility Room
- Washer and Dryer Hookup
Kitchen
- Oven or Range
- Range Hood
- Microwave
- Dishwasher
- Granite Countertops
- Disposal
Flooring
- Ceramic Tile
- Vinyl Plank
Bedrooms and Bathrooms
- 3 Bedrooms
- 1.5 Bathrooms
Outdoor Features
- Covered Patio or Porch
Schools
- Eisenhower Elementary And Middle School
- Eisenhower High School
Utilities
- Central Heating and Cooling System
- Heating System Uses Gas
- Gas Water Heater
Map
Create a Home Valuation Report for This Property
The Home Valuation Report is an in-depth analysis detailing your home's value as well as a comparison with similar homes in the area
Home Values in the Area
Average Home Value in this Area
Tax History
| Year | Tax Paid | Tax Assessment Tax Assessment Total Assessment is a certain percentage of the fair market value that is determined by local assessors to be the total taxable value of land and additions on the property. | Land | Improvement |
|---|---|---|---|---|
| 2025 | $790 | $7,323 | $450 | $6,873 |
| 2024 | $755 | $6,974 | $450 | $6,524 |
| 2023 | $755 | $6,974 | $450 | $6,524 |
| 2022 | $743 | $6,974 | $450 | $6,524 |
| 2021 | $820 | $8,016 | $1,125 | $6,891 |
| 2020 | $897 | $8,818 | $1,125 | $7,693 |
| 2019 | $890 | $8,818 | $1,125 | $7,693 |
| 2018 | $910 | $9,144 | $1,125 | $8,019 |
| 2017 | $783 | $9,144 | $1,125 | $8,019 |
| 2016 | $872 | $9,923 | $1,125 | $8,798 |
| 2015 | $887 | $9,923 | $1,125 | $8,798 |
| 2014 | $878 | $9,923 | $1,125 | $8,798 |
Source: Public Records
Property History
| Date | Event | Price | List to Sale | Price per Sq Ft |
|---|---|---|---|---|
| 11/20/2025 11/20/25 | Pending | -- | -- | -- |
| 11/07/2025 11/07/25 | For Sale | $154,000 | -- | $110 / Sq Ft |
Source: Lawton Board of REALTORS®
Purchase History
| Date | Type | Sale Price | Title Company |
|---|---|---|---|
| Sheriffs Deed | $26,600 | None Listed On Document | |
| Quit Claim Deed | -- | None Listed On Document | |
| Quit Claim Deed | -- | None Listed On Document | |
| Quit Claim Deed | -- | None Listed On Document | |
| Special Warranty Deed | -- | -- | |
| Warranty Deed | $59,000 | -- | |
| Warranty Deed | $24,500 | -- | |
| Warranty Deed | -- | -- | |
| Warranty Deed | $55,500 | -- |
Source: Public Records
Mortgage History
| Date | Status | Loan Amount | Loan Type |
|---|---|---|---|
| Previous Owner | $43,200 | Adjustable Rate Mortgage/ARM |
Source: Public Records
About the Listing Agent
Local Lawton REALTOR® with outstanding customer service and communication skills. Quick facts about me:
* Multi-Million Dollar Producer
* Born and raised in Lawton, OK
* Certified Military Relocation Professional (MRP)
* 14+ years of internet marketing experience (great for sellers)
* Innovative problem solver (great for buyers)
* Fun-loving REALTOR® who'll keep you laughing from start to finish
Whether you're a first-time buyer, an overwhelmed seller, or a
HEAVEN's Other Listings
Source: Lawton Board of REALTORS®
MLS Number: 170020
APN: 160040660
Disclaimer: Certain information contained herein is derived from information provided by parties other than Homes.com. All information provided is deemed reliable, but is not guaranteed to be accurate and should be independently verified.
![]() IDX information is provided exclusively for personal, non-commercial use, and may not be used for any purpose other than to identify prospective properties consumers may be interested in purchasing. Information is deemed reliable but not guaranteed.
IDX information is provided exclusively for personal, non-commercial use, and may not be used for any purpose other than to identify prospective properties consumers may be interested in purchasing. Information is deemed reliable but not guaranteed.
Nearby Homes
- 4610 SW H Ave
- 714 SW 46th St
- 706 SW 49th St
- 78 SW 45th St
- 72 SW 45th St
- 4500 SW Lee Blvd
- 4632 SW Beta Ave
- 4508 SW Cherokee Ave
- 4627 SW Atom Ave
- 4629 SW Atom Ave
- 4702 SW Malcom Rd
- 4508 SW Beta Ave
- 5008 SW Country Club Dr
- 929 SW 37th St
- 4302 SW Christina Ct
- 7 SW 49th St
- 3904 SW Parkridge Blvd
- 927 SW 36th St
- 1601 SW Edward Cir
- 2025 SW 45th St