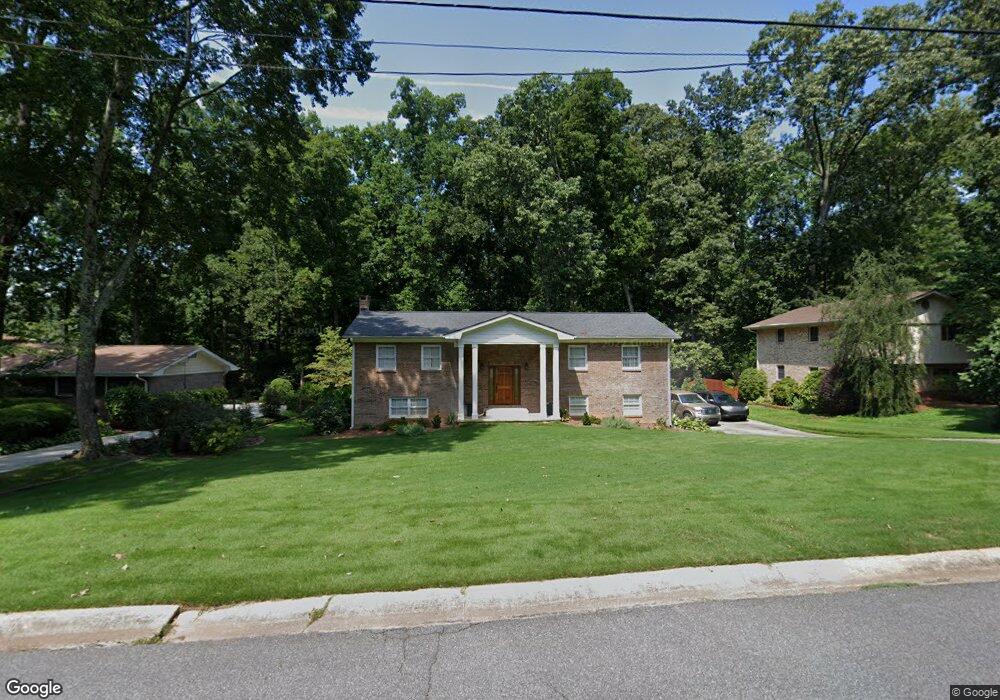
4704 Dunover Cir Unit 2 Atlanta, GA 30360
Estimated Value: $559,000 - $651,000
4
Beds
3
Baths
2,376
Sq Ft
$261/Sq Ft
Est. Value
About This Home
This home is located at 4704 Dunover Cir Unit 2, Atlanta, GA 30360 and is currently estimated at $620,687, approximately $261 per square foot. 4704 Dunover Cir Unit 2 is a home located in DeKalb County with nearby schools including Chesnut Elementary School, Peachtree Middle School, and Dunwoody High School.
Ownership History
Date
Name
Owned For
Owner Type
Purchase Details
Closed on
Feb 23, 2018
Sold by
Koch John H
Bought by
Koch John Howard and Koch Dana Michelle
Current Estimated Value
Purchase Details
Closed on
Nov 17, 2006
Sold by
Coleman James E and Coleman Crista J
Bought by
Koch John H
Home Financials for this Owner
Home Financials are based on the most recent Mortgage that was taken out on this home.
Original Mortgage
$26,440
Interest Rate
6.33%
Mortgage Type
Stand Alone Refi Refinance Of Original Loan
Purchase Details
Closed on
Dec 16, 1996
Sold by
Taylor Roger D
Bought by
Coelman James E Crista
Purchase Details
Closed on
Aug 28, 1996
Sold by
Dyches B H Elizabeth
Bought by
Taylor Robert D
Create a Home Valuation Report for This Property
The Home Valuation Report is an in-depth analysis detailing your home's value as well as a comparison with similar homes in the area
Home Values in the Area
Average Home Value in this Area
Purchase History
| Date | Buyer | Sale Price | Title Company |
|---|---|---|---|
| Koch John Howard | -- | -- | |
| Koch John H | $264,400 | -- | |
| Coelman James E Crista | $167,500 | -- | |
| Taylor Robert D | $154,000 | -- |
Source: Public Records
Mortgage History
| Date | Status | Borrower | Loan Amount |
|---|---|---|---|
| Previous Owner | Koch John H | $26,440 | |
| Closed | Taylor Robert D | $0 |
Source: Public Records
Tax History Compared to Growth
Tax History
| Year | Tax Paid | Tax Assessment Tax Assessment Total Assessment is a certain percentage of the fair market value that is determined by local assessors to be the total taxable value of land and additions on the property. | Land | Improvement |
|---|---|---|---|---|
| 2024 | $5,580 | $215,280 | $59,200 | $156,080 |
| 2023 | $5,580 | $169,600 | $59,200 | $110,400 |
| 2022 | $4,529 | $169,600 | $59,200 | $110,400 |
| 2021 | $3,983 | $174,200 | $59,200 | $115,000 |
| 2020 | $4,293 | $158,400 | $59,200 | $99,200 |
| 2019 | $4,017 | $148,800 | $59,200 | $89,600 |
| 2018 | $3,442 | $140,920 | $59,200 | $81,720 |
| 2017 | $4,021 | $131,840 | $58,360 | $73,480 |
| 2016 | $3,685 | $121,520 | $58,360 | $63,160 |
| 2014 | $2,853 | $88,000 | $58,280 | $29,720 |
Source: Public Records
Map
Nearby Homes
- 4834 Tilly Mill Rd
- 2511 Cherry Hill Ln
- 2695 Peeler Rd
- 4962 Tilly Mill Rd
- 4567 Sharon Valley Ct Unit 12
- 2428 Peeler Rd
- 2551 Briers North Dr
- 2624 E Madison Dr
- 2597 E Madison Dr
- 2484 Madison Commons
- 4610 Brierwood Place
- 2611 Briers Dr N
- 2368 Peeler Rd
- 4617 N Peachtree Rd
- 2600 Amberly Dr
- 2631 Holliston Ct
- 2300 Peachford Rd Unit 3108
- 2300 Peachford Rd Unit 1209
- 4712 Dunover Cir Unit 2
- 2389 Riverglenn Ct
- 4701 Dunover Cir Unit 2
- 0 Riverglenn Ct Unit 7607423
- 0 Riverglenn Ct
- 4686 Dunover Cir
- 4719 Dunover Cir
- 2399 Riverglenn Ct
- 2379 Riverglenn Ct
- 4720 Dunover Cir Unit 2
- 4693 Dunover Cir
- 2396 Ledgewood Dr
- 2388 Ledgewood Dr Unit 14B
- 4737 Dunover Cir
- 4737 Dunover Cir Unit 4737
- 4685 Dunover Cir
- 2407 Riverglenn Ct
- 4726 Dunover Cir
- 0 Dunover Cir Unit 7525027
- 0 Dunover Cir Unit 7452851