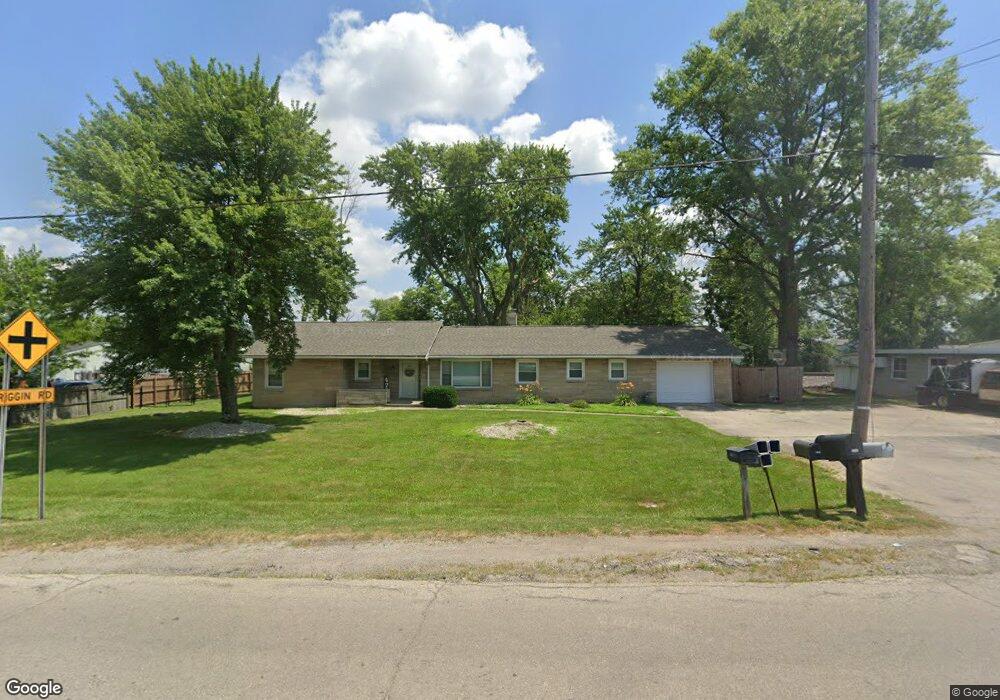
4704 N Old State Rd 3 Muncie, IN 47303
Estimated Value: $164,000 - $175,000
3
Beds
2
Baths
1,628
Sq Ft
$104/Sq Ft
Est. Value
About This Home
This home is located at 4704 N Old State Rd 3, Muncie, IN 47303 and is currently estimated at $169,632, approximately $104 per square foot. 4704 N Old State Rd 3 is a home located in Delaware County with nearby schools including Longfellow Elementary School, Muncie Central High School, and Northside Middle School.
Ownership History
Date
Name
Owned For
Owner Type
Purchase Details
Closed on
May 4, 2021
Sold by
Smoot Aaron
Bought by
Lindell Erin M
Current Estimated Value
Home Financials for this Owner
Home Financials are based on the most recent Mortgage that was taken out on this home.
Original Mortgage
$121,361
Outstanding Balance
$109,983
Interest Rate
3.1%
Mortgage Type
FHA
Estimated Equity
$59,649
Purchase Details
Closed on
Feb 22, 2013
Sold by
Ohio Investments Llc
Bought by
Smoot Aaron
Purchase Details
Closed on
Oct 10, 2012
Sold by
Secretary Of Housing & Urban Development
Bought by
Oho Investments Llc
Purchase Details
Closed on
Jan 3, 2012
Sold by
Gmac Mortgage Llc
Bought by
Secretary Of Housing & Urban Development
Purchase Details
Closed on
Dec 14, 2011
Sold by
Beeler Sandra G
Bought by
Gmac Mortgage Llc
Create a Home Valuation Report for This Property
The Home Valuation Report is an in-depth analysis detailing your home's value as well as a comparison with similar homes in the area
Home Values in the Area
Average Home Value in this Area
Purchase History
| Date | Buyer | Sale Price | Title Company |
|---|---|---|---|
| Lindell Erin M | $123,600 | None Available | |
| Smoot Aaron | -- | Youngs Title | |
| Oho Investments Llc | -- | None Available | |
| Secretary Of Housing & Urban Development | -- | None Available | |
| Gmac Mortgage Llc | $33,600 | None Available |
Source: Public Records
Mortgage History
| Date | Status | Borrower | Loan Amount |
|---|---|---|---|
| Open | Lindell Erin M | $121,361 |
Source: Public Records
Tax History Compared to Growth
Tax History
| Year | Tax Paid | Tax Assessment Tax Assessment Total Assessment is a certain percentage of the fair market value that is determined by local assessors to be the total taxable value of land and additions on the property. | Land | Improvement |
|---|---|---|---|---|
| 2024 | $1,404 | $128,600 | $13,600 | $115,000 |
| 2023 | $1,470 | $128,600 | $13,600 | $115,000 |
| 2022 | $828 | $69,400 | $13,600 | $55,800 |
| 2021 | $784 | $65,000 | $13,600 | $51,400 |
| 2020 | $1,426 | $65,000 | $13,600 | $51,400 |
| 2019 | $1,428 | $93,200 | $13,600 | $79,600 |
| 2018 | $2,111 | $98,900 | $13,600 | $85,300 |
| 2017 | $2,085 | $97,600 | $13,600 | $84,000 |
| 2016 | $2,085 | $97,600 | $13,600 | $84,000 |
| 2014 | $1,858 | $89,500 | $13,600 | $75,900 |
| 2013 | -- | $88,700 | $13,600 | $75,100 |
Source: Public Records
Map
Nearby Homes
- 4605 N Terri Ln
- 2020 E Indiana Ave
- 1915 E Purdue Rd
- 1720 E Yale Ave
- 1720 E Cornell Ave
- 2103 E Yale Ave
- 2309 E Depauw Ave
- 3900 N Bellaire Ave
- 2313 E Cornell Ave
- 5915 Old State Road 3
- 2220 E Dartmouth Ave
- 300 E Charter Dr
- 215 E Charter Dr
- 2900 E County Road 350 N
- 809 E Dunn Ave
- 2808 E Mcgalliard Rd
- 107 E Berkley Ave
- 300 W Horizon Rd
- 627 E Pine St
- 2317 N Turner St
- 4704 N Old Sr 3n
- 4704 Old State Road 3
- 4704 N Sr 3
- 4703 N Old State Rd 3
- 4701 N Old State Rd 3
- 4617 N Old State Rd 3
- 0 Hickory Ct Unit HICKORY HILLS LOTS 8
- 0 Hickory Ct
- 1500 E Riggin Rd
- 10 E Dogwood Dr
- 4410 N Old State Road 3
- 101 Eastwood Dr
- 4405 N Sr 3
- 4404 N Old State Rd 3
- 4404 N Old State Rd 3
- 4402 Old State Road 3
- 4415 N Broadway Ave
- 4402 N Old State Rd 3
- 1301 E Riggin Rd
- 4411 N Broadway Ave