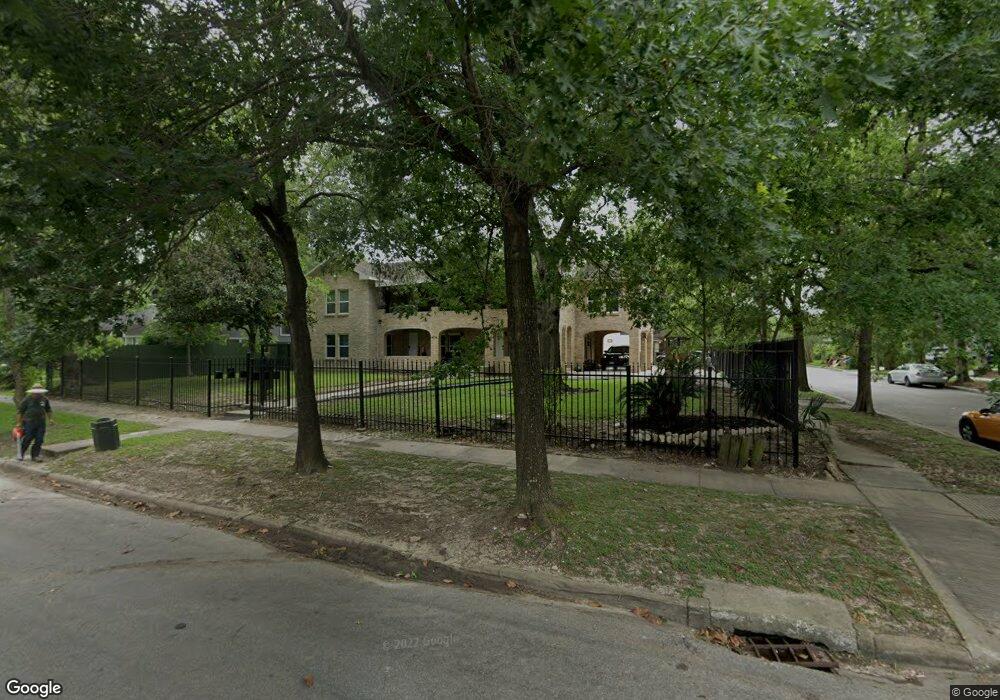
4704 Park Dr Unit 1 Houston, TX 77023
Eastwood NeighborhoodEstimated Value: $748,000
1
Bed
1
Bath
4,945
Sq Ft
$151/Sq Ft
Est. Value
About This Home
This home is located at 4704 Park Dr Unit 1, Houston, TX 77023 and is currently estimated at $748,000, approximately $151 per square foot. 4704 Park Dr Unit 1 is a home located in Harris County with nearby schools including Cage Elementary School, Yolanda Black Navarro Middle School, and Austin High School.
Ownership History
Date
Name
Owned For
Owner Type
Purchase Details
Closed on
Sep 1, 2016
Sold by
July 15 Real Estate Llc
Bought by
4704 Park Llc
Current Estimated Value
Purchase Details
Closed on
Oct 14, 2014
Sold by
Jjj Holdings Llc
Bought by
July 15 Real Estate Llc
Purchase Details
Closed on
Dec 26, 2012
Sold by
Maldonado Linda Marie Flores and Villareal Linda Marie Flores
Bought by
Flores Robert R
Create a Home Valuation Report for This Property
The Home Valuation Report is an in-depth analysis detailing your home's value as well as a comparison with similar homes in the area
Home Values in the Area
Average Home Value in this Area
Purchase History
| Date | Buyer | Sale Price | Title Company |
|---|---|---|---|
| 4704 Park Llc | -- | Integrity Title Co Llc | |
| July 15 Real Estate Llc | -- | Title Houston Holdings Ltd | |
| Flores Robert R | -- | Fidelity National Title | |
| Jjj Holdings Llc | -- | Fidelity National Title |
Source: Public Records
Tax History Compared to Growth
Tax History
| Year | Tax Paid | Tax Assessment Tax Assessment Total Assessment is a certain percentage of the fair market value that is determined by local assessors to be the total taxable value of land and additions on the property. | Land | Improvement |
|---|---|---|---|---|
| 2025 | $12,594 | $580,000 | $275,480 | $304,520 |
| 2024 | $12,594 | $601,900 | $275,480 | $326,420 |
| 2023 | $12,594 | $652,234 | $275,480 | $376,754 |
| 2022 | $13,316 | $566,200 | $261,706 | $304,494 |
| 2021 | $10,515 | $451,159 | $220,384 | $230,775 |
| 2020 | $11,225 | $485,603 | $220,384 | $265,219 |
| 2019 | $13,938 | $608,912 | $185,949 | $422,963 |
| 2018 | $12,331 | $487,300 | $170,050 | $317,250 |
| 2017 | $13,053 | $487,300 | $170,050 | $317,250 |
| 2016 | $15,473 | $577,674 | $295,350 | $282,324 |
| 2015 | $12,700 | $515,362 | $202,315 | $313,047 |
| 2014 | $12,700 | $494,028 | $177,210 | $316,818 |
Source: Public Records
Map
Nearby Homes