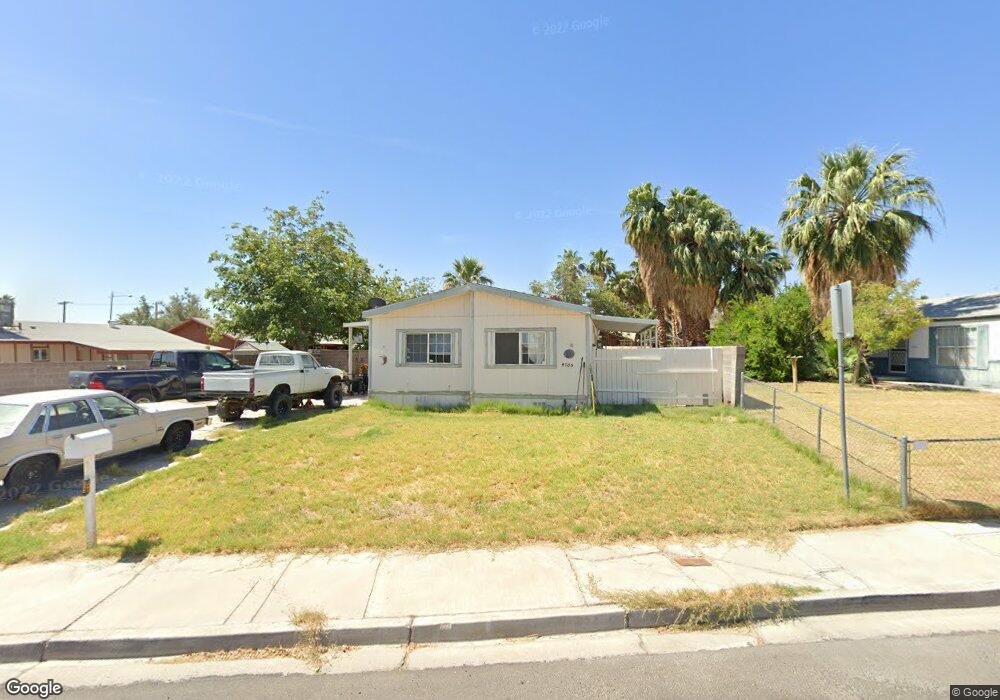
4705 Largo Way Las Vegas, NV 89121
Paradise Valley East NeighborhoodEstimated Value: $235,000 - $308,000
3
Beds
2
Baths
1,332
Sq Ft
$207/Sq Ft
Est. Value
About This Home
This home is located at 4705 Largo Way, Las Vegas, NV 89121 and is currently estimated at $275,667, approximately $206 per square foot. 4705 Largo Way is a home located in Clark County with nearby schools including Hal Smith Elementary School, Kathleen & Tim Harney Middle School, and Chaparral High School.
Ownership History
Date
Name
Owned For
Owner Type
Purchase Details
Closed on
Sep 7, 2016
Sold by
Gardner Marilyn A
Bought by
Garner Marilyn A and The Marilyn A Gardner Living Trust
Current Estimated Value
Purchase Details
Closed on
Nov 15, 2001
Sold by
Gardner Marilyn A
Bought by
Gardner Marilyn A
Home Financials for this Owner
Home Financials are based on the most recent Mortgage that was taken out on this home.
Original Mortgage
$65,600
Interest Rate
6.57%
Purchase Details
Closed on
Mar 25, 1999
Sold by
Gardner Marilyn A and Morse Marilyn
Bought by
Gardner Marilyn A and The Marilyn Gardner Family Trust
Purchase Details
Closed on
Oct 7, 1998
Sold by
Gardner Marilyn A
Bought by
Gardner Marilyn A and The Marilyn A Gardner Family Trust
Create a Home Valuation Report for This Property
The Home Valuation Report is an in-depth analysis detailing your home's value as well as a comparison with similar homes in the area
Home Values in the Area
Average Home Value in this Area
Purchase History
| Date | Buyer | Sale Price | Title Company |
|---|---|---|---|
| Garner Marilyn A | -- | None Available | |
| Gardner Marilyn A | -- | Land Title | |
| Gardner Marilyn A | -- | -- | |
| Gardner Marilyn A | -- | -- |
Source: Public Records
Mortgage History
| Date | Status | Borrower | Loan Amount |
|---|---|---|---|
| Previous Owner | Gardner Marilyn A | $65,600 |
Source: Public Records
Tax History Compared to Growth
Tax History
| Year | Tax Paid | Tax Assessment Tax Assessment Total Assessment is a certain percentage of the fair market value that is determined by local assessors to be the total taxable value of land and additions on the property. | Land | Improvement |
|---|---|---|---|---|
| 2025 | $660 | $58,342 | $28,000 | $30,342 |
| 2024 | $641 | $58,342 | $28,000 | $30,342 |
| 2023 | $641 | $46,658 | $18,200 | $28,458 |
| 2022 | $622 | $44,219 | $18,200 | $26,019 |
| 2021 | $604 | $39,809 | $15,050 | $24,759 |
| 2020 | $584 | $36,478 | $11,900 | $24,578 |
| 2019 | $567 | $32,767 | $8,400 | $24,367 |
| 2018 | $550 | $30,558 | $7,000 | $23,558 |
| 2017 | $756 | $25,779 | $7,000 | $18,779 |
| 2016 | $597 | $23,273 | $6,300 | $16,973 |
| 2015 | $520 | $18,414 | $3,850 | $14,564 |
| 2014 | $505 | $21,790 | $5,250 | $16,540 |
Source: Public Records
Map
Nearby Homes
- 4723 Esplanade Way
- 4658 Hildago Way
- 4650 E Twain Ave
- 4731 Fuentes Way
- 4505 E Desert Inn Rd Unit 46
- 4906 Mar Vista Way
- 4938 Vista Flora Way
- 3603 Huerta Dr
- 3529 Allegheny Dr
- 3489 Big Sur Dr
- 3158 Palmdale St
- 0 S Nellis Blvd
- 3750 Florrie Ave
- 3652 Allegheny Dr
- 3127 Aloha Ave
- 3441 Cape Cod Dr
- 4323 E Twain Ave Unit 4
- 3578 Anthony Dr
- 3341 Death Valley Dr
- 3464 Death Valley Dr
- 4683 Largo Way
- 3513 Indios Ave
- 3521 Indios Ave
- 4698 Madera Way
- 3529 Indios Ave
- 4671 Largo Way
- 4708 Largo Way
- 4682 Largo Way
- 4657 Madera Way
- 4659 Largo Way
- 4670 Largo Way
- 3520 Indios Ave
- 3512 Indios Ave
- 3547 Indios Ave
- 4658 Largo Way
- 4709 Esplanade Way
- 4683 Esplanade Way
- 4687 Madera Way
- 4757 Vista Flora Way
- 4671 Esplanade Way