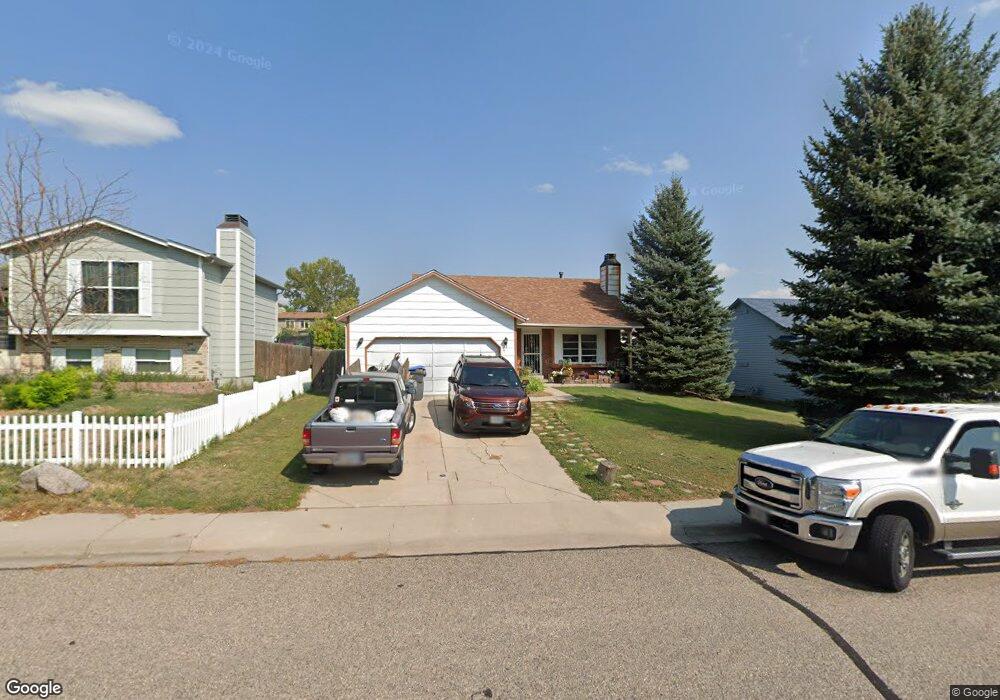
4705 Ocean Loop Cheyenne, WY 82009
Estimated Value: $333,336 - $411,000
Studio
1
Bath
1,212
Sq Ft
$308/Sq Ft
Est. Value
About This Home
This home is located at 4705 Ocean Loop, Cheyenne, WY 82009 and is currently estimated at $372,834, approximately $307 per square foot. 4705 Ocean Loop is a home located in Laramie County with nearby schools including Dildine Elementary School, Carey Junior High School, and East High School.
Ownership History
Date
Name
Owned For
Owner Type
Purchase Details
Closed on
Mar 24, 2008
Sold by
Jacobsen Corey T and Jacobsen Justine A
Bought by
Jacobsen Corey T and Jacobsen Justine A
Current Estimated Value
Home Financials for this Owner
Home Financials are based on the most recent Mortgage that was taken out on this home.
Original Mortgage
$109,600
Outstanding Balance
$68,206
Interest Rate
5.72%
Mortgage Type
New Conventional
Estimated Equity
$304,628
Purchase Details
Closed on
Nov 23, 1998
Sold by
Cendant Mobility Services Corp
Bought by
Jacobsen Corey T and Neill Justine A
Home Financials for this Owner
Home Financials are based on the most recent Mortgage that was taken out on this home.
Original Mortgage
$91,820
Interest Rate
6.83%
Mortgage Type
FHA
Purchase Details
Closed on
Oct 30, 1998
Sold by
Engebretson Matthew S and Engebretson Linda R
Bought by
Cendant Mobility Services Corp
Home Financials for this Owner
Home Financials are based on the most recent Mortgage that was taken out on this home.
Original Mortgage
$91,820
Interest Rate
6.83%
Mortgage Type
FHA
Create a Home Valuation Report for This Property
The Home Valuation Report is an in-depth analysis detailing your home's value as well as a comparison with similar homes in the area
Purchase History
| Date | Buyer | Sale Price | Title Company |
|---|---|---|---|
| Jacobsen Corey T | -- | None Available | |
| Jacobsen Corey T | -- | -- | |
| Cendant Mobility Services Corp | -- | -- |
Source: Public Records
Mortgage History
| Date | Status | Borrower | Loan Amount |
|---|---|---|---|
| Open | Jacobsen Corey T | $109,600 | |
| Previous Owner | Jacobsen Corey T | $91,820 |
Source: Public Records
Tax History
| Year | Tax Paid | Tax Assessment Tax Assessment Total Assessment is a certain percentage of the fair market value that is determined by local assessors to be the total taxable value of land and additions on the property. | Land | Improvement |
|---|---|---|---|---|
| 2025 | $1,672 | $18,305 | $3,338 | $14,967 |
| 2024 | $1,672 | $23,640 | $4,451 | $19,189 |
| 2023 | $1,659 | $23,456 | $4,451 | $19,005 |
| 2022 | $1,571 | $21,761 | $4,451 | $17,310 |
| 2021 | $1,411 | $19,506 | $4,451 | $15,055 |
| 2020 | $1,288 | $17,850 | $4,451 | $13,399 |
| 2019 | $1,215 | $16,832 | $4,451 | $12,381 |
| 2018 | $1,117 | $15,617 | $3,348 | $12,269 |
| 2017 | $1,078 | $14,940 | $3,348 | $11,592 |
| 2016 | $1,024 | $14,184 | $3,168 | $11,016 |
| 2015 | $962 | $13,317 | $3,168 | $10,149 |
| 2014 | $956 | $13,153 | $3,168 | $9,985 |
Source: Public Records
Map
Nearby Homes
- 4400 Everton Dr
- 4700 Shell Beach Ave
- TBD Lot 38 Panorama Dr
- TBD Lot 44 Panorama Dr
- TBD Lot 34 Panorama Dr
- TBD Lot 40 Panorama Dr
- TBD Lot 35 Panorama Dr
- TBD Lot 36 Panorama Dr
- TBD Lot 37 Panorama Dr
- TBD Lot 39 Panorama Dr
- Lot 1, Block 1 Sullivan St
- Lot 2, Block 1 Sullivan St
- Lots 1-8 Connie Dr
- Lot 3, Block 1 Sullivan St
- Lot 4, Block 1 Sullivan St
- Lot 8, Block 1 Sullivan St
- Lot 7, Block 1 Sullivan St
- Lot 5, Block 1 Sullivan St
- Lot 6, Block 1 Sullivan St
- 4704 Garnet Way
- 4709 Ocean Loop
- 4701 Ocean Loop
- 4715 Ocean Loop
- 4708 Big Sur Ave
- 4700 Big Sur Ave
- 4712 Big Sur Ave
- 4501 Ocean Loop
- 4716 Big Sur Ave
- 4700 Ocean Loop
- 4720 Big Sur Ave
- 4601 Big Sur Ave
- 4701 Big Sur Ave
- 4707 Big Sur Ave
- 4711 Big Sur Ave
- 4415 Everton Dr
- 4500 Dell Range Blvd
- 4416 Everton Dr
- 4715 Big Sur Ave
- 4605 Big Sur Ave
- 4608 Ontario Ave
Your Personal Tour Guide
Ask me questions while you tour the home.