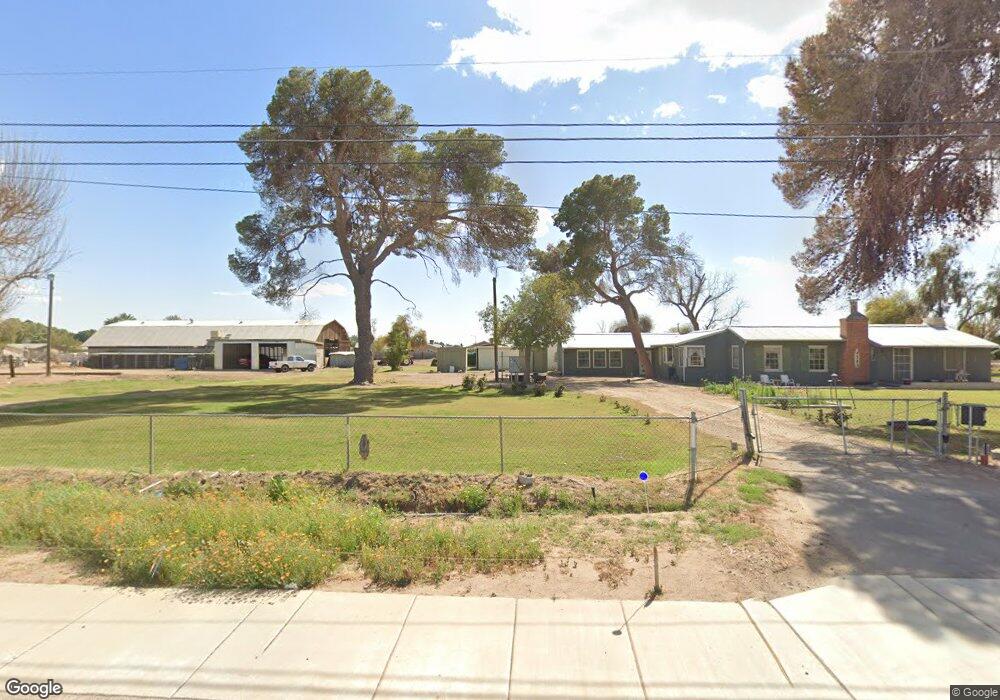
4705 W 8th St Yuma, AZ 85364
Valley Citrus Estates NeighborhoodEstimated Value: $69,000 - $488,803
3
Beds
2
Baths
4,718
Sq Ft
$57/Sq Ft
Est. Value
About This Home
This home is located at 4705 W 8th St, Yuma, AZ 85364 and is currently estimated at $268,201, approximately $56 per square foot. 4705 W 8th St is a home with nearby schools including Salida Del Sol Elementary School, Rancho Viejo Elementary School, and Crane Middle School.
Ownership History
Date
Name
Owned For
Owner Type
Purchase Details
Closed on
Mar 21, 2019
Sold by
Wright Robert B and Wright Jayne H
Bought by
Wright Robert B and Wright Jayne H
Current Estimated Value
Home Financials for this Owner
Home Financials are based on the most recent Mortgage that was taken out on this home.
Original Mortgage
$296,386
Outstanding Balance
$260,574
Interest Rate
4.4%
Mortgage Type
Commercial
Estimated Equity
$7,627
Purchase Details
Closed on
May 1, 2017
Sold by
Wright Robert B and Wright Jayne H
Bought by
Wright Robert B and Wright Jayne H
Purchase Details
Closed on
Nov 9, 2016
Sold by
Boyer Brian Thomas
Bought by
Wright Robert B and Wright Jayne H
Home Financials for this Owner
Home Financials are based on the most recent Mortgage that was taken out on this home.
Original Mortgage
$157,102
Interest Rate
4.25%
Mortgage Type
FHA
Create a Home Valuation Report for This Property
The Home Valuation Report is an in-depth analysis detailing your home's value as well as a comparison with similar homes in the area
Home Values in the Area
Average Home Value in this Area
Purchase History
| Date | Buyer | Sale Price | Title Company |
|---|---|---|---|
| Wright Robert B | -- | Accommodation | |
| Wright Robert B | -- | Pioneer Title Agency Inc | |
| Wright Robert B | -- | Pioneer Title Agency | |
| Wright Robert B | $160,000 | Pioneer Title Agency Inc |
Source: Public Records
Mortgage History
| Date | Status | Borrower | Loan Amount |
|---|---|---|---|
| Open | Wright Robert B | $296,386 | |
| Previous Owner | Wright Robert B | $157,102 |
Source: Public Records
Tax History Compared to Growth
Tax History
| Year | Tax Paid | Tax Assessment Tax Assessment Total Assessment is a certain percentage of the fair market value that is determined by local assessors to be the total taxable value of land and additions on the property. | Land | Improvement |
|---|---|---|---|---|
| 2025 | $2,535 | $29,389 | $7,671 | $21,718 |
| 2024 | $2,413 | $27,990 | $7,549 | $20,441 |
| 2023 | $2,413 | $26,657 | $8,419 | $18,238 |
| 2022 | $2,348 | $25,387 | $7,001 | $18,386 |
| 2021 | $2,512 | $24,179 | $8,010 | $16,169 |
| 2020 | $2,437 | $23,027 | $9,386 | $13,641 |
| 2019 | $2,516 | $21,932 | $9,768 | $12,164 |
| 2018 | $2,343 | $20,886 | $7,647 | $13,239 |
| 2017 | $2,304 | $20,886 | $7,647 | $13,239 |
| 2016 | $2,516 | $18,944 | $7,067 | $11,877 |
| 2015 | $1,795 | $18,043 | $9,925 | $8,118 |
| 2014 | $1,795 | $17,583 | $9,925 | $7,658 |
Source: Public Records
Map
Nearby Homes
- 4806 W 8th St
- 8692 S Mojave Ln
- 1051 S 47th Ave
- 5117 W Poppy St
- 8324 S Coconino Ln
- 4720 W Clip St
- 7755 S Hope Ave
- 4282 W 12th Place
- 4447 W 14th Place
- 424 S 45th Way
- 7797 S Phillips Ave
- 5560 W 8th St
- 4080 W Linda Ln
- 1370 S 42nd Dr
- 620 S Avenue C
- 1570 S 46th Ave
- 4114 W 13th Place
- 851 S Eleanor Ave
- 4302 W 14th Ln
- 530 S Avenue C
- 4718 W 8th Ln
- 4724 W 8th Ln
- 8128 S Yavapai Ln
- 8136 S Yavapai Ln
- 4748 W 8th Ln
- 901 S 47th Ave
- 4754 W 8th Ln
- 4774 W 8th Ln
- 4762 W 8th Ln
- 8176 S Yavapai Ln
- 4768 W 8th Ln
- 4768 W 8th Ln
- 905 S 47th Ave
- 904 S 47th Ave
- 909 S 47th Ave
- 908 S 47th Ave
- 903 S 47th Dr
- 907 S 47th Dr
- 8120 S Mojave Ln
- 918 S 47th Ave