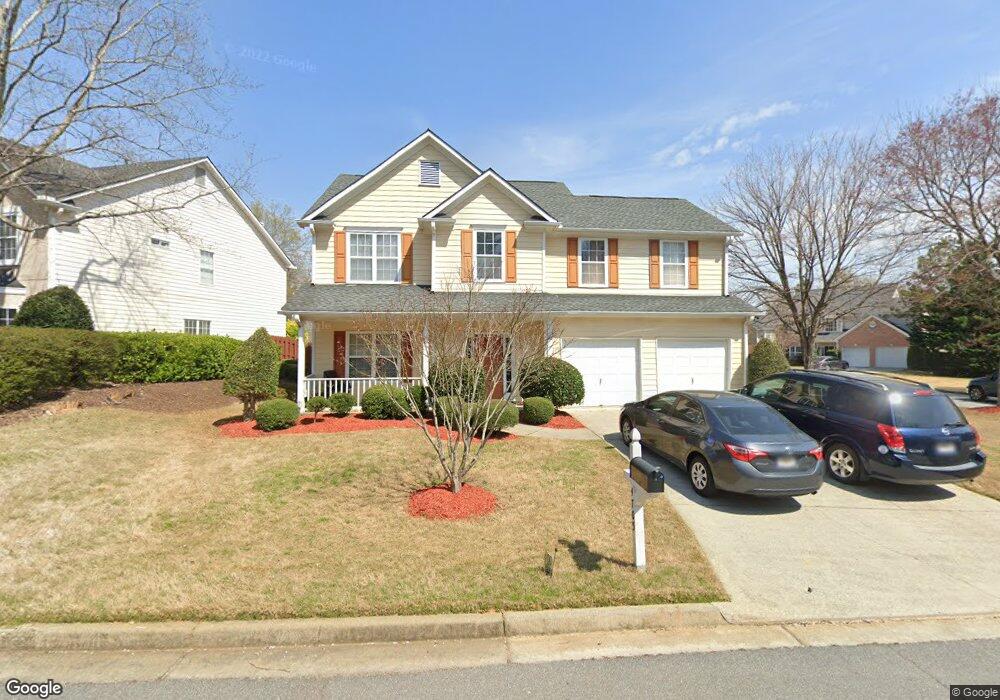
4705 Weathervane Dr Alpharetta, GA 30022
Estimated Value: $549,000 - $636,000
4
Beds
3
Baths
2,084
Sq Ft
$279/Sq Ft
Est. Value
About This Home
This home is located at 4705 Weathervane Dr, Alpharetta, GA 30022 and is currently estimated at $581,576, approximately $279 per square foot. 4705 Weathervane Dr is a home located in Fulton County with nearby schools including Ocee Elementary School, Taylor Road Middle School, and Chattahoochee High School.
Ownership History
Date
Name
Owned For
Owner Type
Purchase Details
Closed on
Jun 5, 2001
Sold by
Dommety Sarita K and Dommety Anantha K
Bought by
Andhavarapu Koteswara
Current Estimated Value
Home Financials for this Owner
Home Financials are based on the most recent Mortgage that was taken out on this home.
Original Mortgage
$153,600
Interest Rate
7.11%
Mortgage Type
New Conventional
Purchase Details
Closed on
Sep 30, 1996
Sold by
Beazer Homes Corp
Bought by
Dommety Anantha K Sarita
Create a Home Valuation Report for This Property
The Home Valuation Report is an in-depth analysis detailing your home's value as well as a comparison with similar homes in the area
Home Values in the Area
Average Home Value in this Area
Purchase History
| Date | Buyer | Sale Price | Title Company |
|---|---|---|---|
| Andhavarapu Koteswara | $192,000 | -- | |
| Dommety Anantha K Sarita | $146,300 | -- |
Source: Public Records
Mortgage History
| Date | Status | Borrower | Loan Amount |
|---|---|---|---|
| Closed | Andhavarapu Koteswara | $153,600 | |
| Closed | Dommety Anantha K Sarita | $0 |
Source: Public Records
Tax History Compared to Growth
Tax History
| Year | Tax Paid | Tax Assessment Tax Assessment Total Assessment is a certain percentage of the fair market value that is determined by local assessors to be the total taxable value of land and additions on the property. | Land | Improvement |
|---|---|---|---|---|
| 2025 | $1,906 | $231,560 | $58,720 | $172,840 |
| 2023 | $5,521 | $195,600 | $51,160 | $144,440 |
| 2022 | $3,658 | $129,600 | $22,600 | $107,000 |
| 2021 | $1,786 | $129,600 | $22,600 | $107,000 |
| 2020 | $2,746 | $146,480 | $22,600 | $123,880 |
| 2019 | $326 | $114,360 | $26,520 | $87,840 |
| 2018 | $3,070 | $111,680 | $25,920 | $85,760 |
| 2017 | $2,667 | $90,520 | $20,920 | $69,600 |
| 2016 | $2,529 | $87,800 | $20,920 | $66,880 |
| 2015 | $2,557 | $87,800 | $20,920 | $66,880 |
| 2014 | $2,637 | $87,800 | $20,920 | $66,880 |
Source: Public Records
Map
Nearby Homes
- 690 Kimball Parc Way
- 680 Kimball Parc Way
- 4905 Weathervane Dr
- 485 Portrait Cir
- 11390 Ridge Hill Dr
- 4790 Roswell Mill Dr
- 130 Douglas Fir Ct Unit 1
- 310 Creekside Dr
- 11686 Davenport Ln
- 4965 N Bridges Dr
- 11619 Davenport Ln
- 4740 Carversham Way
- 5160 Abbotts Bridge Rd
- 1620 Silverleaf Way
- 410 Fox Chase Cir
- 5060 Cinnabar Dr
- 1140 Park Glenn Dr
- 4965 Cinnabar Dr
- 5022 Anclote Dr
- 134 Wards Crossing Way Unit 17
- 4715 Weathervane Dr Unit .EMPTY
- 4715 Weathervane Dr
- 0 Weathervane Ct Unit 7343314
- 0 Weathervane Ct Unit 8248629
- 510 Weathervane Ct
- 4725 Weathervane Dr
- 4685 Weathervane Dr
- 520 Weathervane Ct
- 4580 Weathervane Dr
- 4590 Weathervane Dr
- 4735 Weathervane Dr
- 4570 Weathervane Dr
- 4600 Weathervane Dr
- 525 Weathervane Ct
- 515 Weathervane Ct
- 4675 Weathervane Dr
- 4610 Weathervane Dr
- 4745 Weathervane Dr
- 4795 Weathervane Dr
- 4620 Weathervane Dr