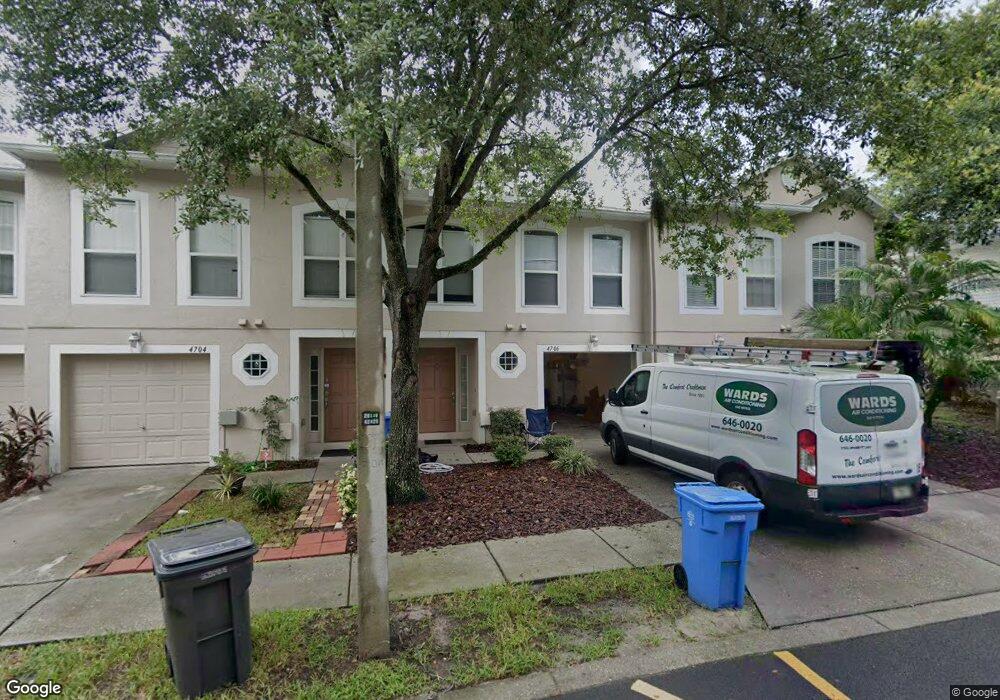
4706 Ashburn Square Dr Tampa, FL 33610
East Lake-Orient Park NeighborhoodEstimated Value: $237,000 - $259,000
3
Beds
3
Baths
1,908
Sq Ft
$129/Sq Ft
Est. Value
About This Home
This home is located at 4706 Ashburn Square Dr, Tampa, FL 33610 and is currently estimated at $246,280, approximately $129 per square foot. 4706 Ashburn Square Dr is a home located in Hillsborough County with nearby schools including Mcdonald Elementary School, Jennings Middle School, and Armwood High School.
Ownership History
Date
Name
Owned For
Owner Type
Purchase Details
Closed on
Sep 18, 2015
Sold by
Robert Michael Fausette Pa
Bought by
Siscoe Stephanie
Current Estimated Value
Purchase Details
Closed on
Aug 14, 2015
Sold by
Secretary Of Housing & Urban Development
Bought by
Robert Michael Fausette Pa
Purchase Details
Closed on
Jul 17, 2014
Sold by
Wells Fargo Bank Na
Bought by
The Secretary Of The Us Department Of Ho
Purchase Details
Closed on
Jun 2, 2014
Sold by
Encinas Mario S
Bought by
Wells Fargo Bank Na
Purchase Details
Closed on
Feb 23, 2006
Sold by
Encinas Wegtilde
Bought by
Encinas Mario S
Purchase Details
Closed on
Jun 29, 2005
Sold by
Maronda Homes Inc
Bought by
Encinas Mario S and Encines Wegtilde
Home Financials for this Owner
Home Financials are based on the most recent Mortgage that was taken out on this home.
Original Mortgage
$133,800
Interest Rate
5.59%
Mortgage Type
FHA
Create a Home Valuation Report for This Property
The Home Valuation Report is an in-depth analysis detailing your home's value as well as a comparison with similar homes in the area
Home Values in the Area
Average Home Value in this Area
Purchase History
| Date | Buyer | Sale Price | Title Company |
|---|---|---|---|
| Siscoe Stephanie | $90,000 | Flagship Title Of Tampa Llp | |
| Robert Michael Fausette Pa | $79,125 | Flagship Title Of Tampa Llp | |
| The Secretary Of The Us Department Of Ho | -- | First Intl Title Inc | |
| Wells Fargo Bank Na | $73,100 | None Available | |
| Encinas Mario S | -- | None Available | |
| Encinas Mario S | $135,900 | Kampf Title & Guaranty Corp |
Source: Public Records
Mortgage History
| Date | Status | Borrower | Loan Amount |
|---|---|---|---|
| Previous Owner | Encinas Mario S | $133,800 |
Source: Public Records
Tax History Compared to Growth
Tax History
| Year | Tax Paid | Tax Assessment Tax Assessment Total Assessment is a certain percentage of the fair market value that is determined by local assessors to be the total taxable value of land and additions on the property. | Land | Improvement |
|---|---|---|---|---|
| 2024 | $3,709 | $221,311 | $22,131 | $199,180 |
| 2023 | $3,397 | $203,140 | $20,314 | $182,826 |
| 2022 | $3,039 | $180,112 | $18,011 | $162,101 |
| 2021 | $2,641 | $126,385 | $12,639 | $113,746 |
| 2020 | $2,478 | $119,917 | $11,992 | $107,925 |
| 2019 | $2,456 | $121,910 | $12,191 | $109,719 |
| 2018 | $2,270 | $108,974 | $0 | $0 |
| 2017 | $2,194 | $103,831 | $0 | $0 |
| 2016 | $2,040 | $94,392 | $0 | $0 |
| 2015 | $1,763 | $78,375 | $0 | $0 |
| 2014 | -- | $70,642 | $0 | $0 |
| 2013 | -- | $57,951 | $0 | $0 |
Source: Public Records
Map
Nearby Homes
- 4656 Ashburn Square Dr
- 4810 Valda Ln Unit 329
- 9810 Fan Palm Way
- 9710 Polak Dr Unit 237
- 9707 Polak Dr Unit 218
- 10125 Ellen Ave
- 10124 Ellen Ave
- 9708 Linda Place Unit 297
- 10201 Hawk Storm Ave
- 9508 Ashburn Creek Ln
- 4801 Allen Way Unit 278
- 4807 Allen Way Unit 281
- 4140 Bismarck Palm Dr
- 10212 Hawk Storm Ave
- 4128 Bismarck Palm Dr
- 9444 Sunset Dr Unit 106
- 4121 Key Thatch Dr
- 9437 Polak Dr Unit 209
- 9407 Tiffany Terrace Unit 350
- 9457 Sunset Dr Unit 89
- 4704 Ashburn Square Dr
- 4702 Ashburn Square Dr
- 4708 Ashburn Square Dr
- 4674 Ashburn Square Dr
- 4712 Ashburn Square Dr
- 4672 Ashburn Square Dr
- 4672 Ashburn Square Dr Unit 4672
- 4670 Ashburn Square Dr
- 4670 Ashburn Square Dr Unit 4670
- 4714 Ashburn Square Dr
- 4668 Ashburn Square Dr
- 4716 Ashburn Square Dr
- 4683 Ashburn Square Dr
- 4679 Ashburn Square Dr
- 4679 Ashburn Square Dr Unit .
- 4681 Ashburn Square Dr
- 9965 Ashburn Lake Dr
- 4677 Ashburn Square Dr
- 4675 Ashburn Square Dr
- 4664 Ashburn Square Dr