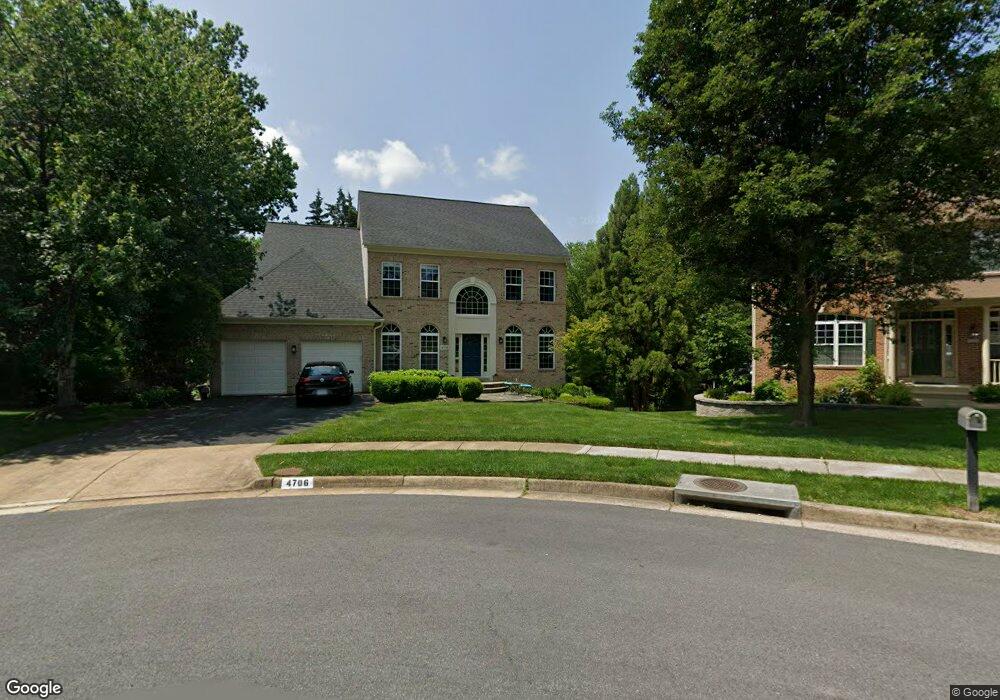
4706 Banting Ct Fairfax, VA 22032
Estimated Value: $1,077,000 - $1,150,678
5
Beds
4
Baths
2,650
Sq Ft
$417/Sq Ft
Est. Value
About This Home
This home is located at 4706 Banting Ct, Fairfax, VA 22032 and is currently estimated at $1,104,670, approximately $416 per square foot. 4706 Banting Ct is a home located in Fairfax County with nearby schools including Laurel Ridge Elementary School, James W Robinson, Jr. Secondary School, and Holy Spirit School.
Ownership History
Date
Name
Owned For
Owner Type
Purchase Details
Closed on
May 2, 2019
Sold by
Brukx Bas J and Brukx Lynn T
Bought by
Bas J Brukx Revocable Trust and Lynn T Brukx Revocable Trust
Current Estimated Value
Purchase Details
Closed on
Nov 17, 2004
Sold by
Crawford Douglas P
Bought by
Brukx Bas J
Home Financials for this Owner
Home Financials are based on the most recent Mortgage that was taken out on this home.
Original Mortgage
$608,000
Interest Rate
5.8%
Mortgage Type
New Conventional
Purchase Details
Closed on
Nov 30, 1998
Sold by
Bo Bud Constr Co Of Va
Bought by
Crawford Douglas P
Home Financials for this Owner
Home Financials are based on the most recent Mortgage that was taken out on this home.
Original Mortgage
$260,000
Interest Rate
6.68%
Create a Home Valuation Report for This Property
The Home Valuation Report is an in-depth analysis detailing your home's value as well as a comparison with similar homes in the area
Home Values in the Area
Average Home Value in this Area
Purchase History
We collect this data history from publicly available records. To have your information removed, we recommend requesting removal directly through your county’s website.
| Date | Buyer | Sale Price | Title Company |
|---|---|---|---|
| Bas J Brukx Revocable Trust | -- | None Available | |
| Brukx Bas J | $760,000 | -- | |
| Crawford Douglas P | $390,911 | -- |
Source: Public Records
Mortgage History
We collect this data history from publicly available records. To have your information removed, we recommend requesting removal directly through your county’s website.
| Date | Status | Borrower | Loan Amount |
|---|---|---|---|
| Previous Owner | Brukx Bas J | $608,000 | |
| Previous Owner | Crawford Douglas P | $260,000 |
Source: Public Records
Tax History
| Year | Tax Paid | Tax Assessment Tax Assessment Total Assessment is a certain percentage of the fair market value that is determined by local assessors to be the total taxable value of land and additions on the property. | Land | Improvement |
|---|---|---|---|---|
| 2025 | $11,506 | $1,059,070 | $366,000 | $693,070 |
| 2024 | $11,506 | $993,200 | $366,000 | $627,200 |
| 2023 | $11,252 | $997,060 | $366,000 | $631,060 |
| 2022 | $9,667 | $845,350 | $306,000 | $539,350 |
| 2021 | $8,951 | $762,800 | $281,000 | $481,800 |
| 2020 | $8,477 | $716,280 | $266,000 | $450,280 |
| 2019 | $8,365 | $706,820 | $261,000 | $445,820 |
| 2018 | $8,128 | $706,820 | $261,000 | $445,820 |
| 2017 | $7,826 | $674,060 | $241,000 | $433,060 |
| 2016 | $7,613 | $657,110 | $231,000 | $426,110 |
| 2015 | $7,333 | $657,110 | $231,000 | $426,110 |
| 2014 | $7,515 | $674,860 | $231,000 | $443,860 |
Source: Public Records
Map
Nearby Homes
- 4750 Carterwood Dr
- 4863 Cove Rd
- 4903 Chantery Ct
- 10174 Bessmer Ln
- 4911 Wycliff Ln
- 4871 Nash Dr
- 5002 Mcfarland Dr
- 5105 Walport Ln
- 4768 Farndon Ct
- 4721 Pickett Rd
- 4749 Farndon Ct
- 4519 Pickett Rd
- 5211 Stonington Dr
- 4984 Swinton Dr
- 4945 Gainsborough Dr
- 10000 Eastlake Dr
- 4630 Luxberry Dr
- 5267 Pumphrey Dr
- 10027 W Constable Ct
- 10256 Friendship Ct
- 4704 Banting Ct
- 9704 Aspen Hollow Way
- 9702 Aspen Hollow Way
- 4707 Banting Ct
- 9706 Aspen Hollow Way
- 4702 Banting Ct
- 5026 Dequincey Dr
- 9708 Aspen Hollow Way
- 9700 Aspen Hollow Way
- 4705 Banting Ct
- 9714 Aspen Hollow Way
- 4700 Banting Ct
- 9710 Aspen Hollow Way
- 4703 Banting Ct
- 9703 Aspen Hollow Way
- 5024 Dequincey Dr
- 9716 Aspen Hollow Way
- 9712 Aspen Hollow Way
- 9701 Aspen Hollow Way
- 4701 Banting Ct
Your Personal Tour Guide
Ask me questions while you tour the home.