4706 River Oaks Rd Clover, SC 29710
Estimated Value: $1,161,000 - $1,451,000
5
Beds
5
Baths
4,939
Sq Ft
$253/Sq Ft
Est. Value
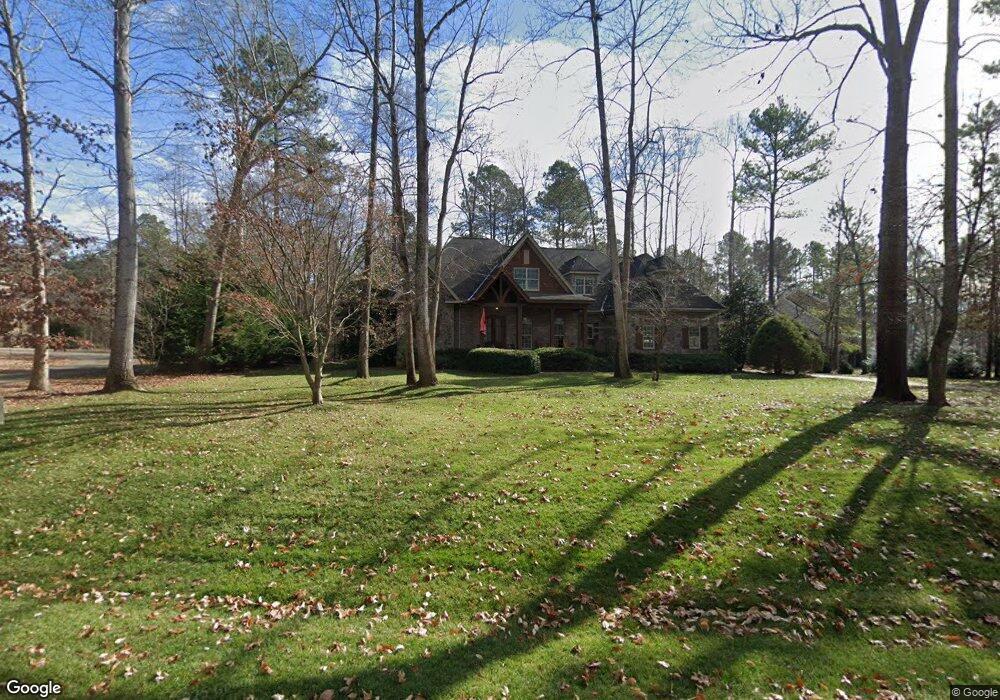
About This Home
This home is located at 4706 River Oaks Rd, Clover, SC 29710 and is currently estimated at $1,249,420, approximately $252 per square foot. 4706 River Oaks Rd is a home located in York County with nearby schools including Oakridge Elementary School, Oakridge Middle School, and Clover High School.
Ownership History
Date
Name
Owned For
Owner Type
Purchase Details
Closed on
Oct 1, 2015
Sold by
Jones Bentley K and Jones Nancy Lynn
Bought by
Cutts Charles Kenneth and Cochran Jennifer Brooke
Current Estimated Value
Home Financials for this Owner
Home Financials are based on the most recent Mortgage that was taken out on this home.
Original Mortgage
$418,000
Outstanding Balance
$312,164
Interest Rate
2.62%
Mortgage Type
Adjustable Rate Mortgage/ARM
Estimated Equity
$937,256
Purchase Details
Closed on
Feb 26, 2009
Sold by
Aspen Homes Llc
Bought by
Jones Bentley K and Jones Nancy Lynn
Home Financials for this Owner
Home Financials are based on the most recent Mortgage that was taken out on this home.
Original Mortgage
$149,000
Interest Rate
5.14%
Mortgage Type
Unknown
Purchase Details
Closed on
Sep 7, 2007
Sold by
May Green Properties Llc
Bought by
Aspen Homes Llc
Create a Home Valuation Report for This Property
The Home Valuation Report is an in-depth analysis detailing your home's value as well as a comparison with similar homes in the area
Home Values in the Area
Average Home Value in this Area
Purchase History
| Date | Buyer | Sale Price | Title Company |
|---|---|---|---|
| Cutts Charles Kenneth | $760,000 | -- | |
| Jones Bentley K | $707,500 | -- | |
| Aspen Homes Llc | $111,900 | None Available |
Source: Public Records
Mortgage History
| Date | Status | Borrower | Loan Amount |
|---|---|---|---|
| Open | Cutts Charles Kenneth | $418,000 | |
| Previous Owner | Jones Bentley K | $149,000 | |
| Previous Owner | Jones Bentley K | $417,000 |
Source: Public Records
Tax History
| Year | Tax Paid | Tax Assessment Tax Assessment Total Assessment is a certain percentage of the fair market value that is determined by local assessors to be the total taxable value of land and additions on the property. | Land | Improvement |
|---|---|---|---|---|
| 2025 | $4,684 | $34,215 | $4,732 | $29,483 |
| 2024 | $4,204 | $29,752 | $4,000 | $25,752 |
| 2023 | $4,311 | $29,750 | $4,000 | $25,750 |
| 2022 | $3,552 | $29,750 | $4,000 | $25,750 |
| 2021 | -- | $29,750 | $4,000 | $25,750 |
| 2020 | $2,915 | $25,750 | $0 | $0 |
| 2019 | $3,562 | $28,840 | $0 | $0 |
| 2018 | $3,579 | $28,840 | $0 | $0 |
| 2017 | $3,334 | $28,840 | $0 | $0 |
| 2016 | $3,141 | $28,840 | $0 | $0 |
| 2014 | $2,613 | $20,720 | $3,000 | $17,720 |
| 2013 | $2,613 | $22,920 | $3,200 | $19,720 |
Source: Public Records
Map
Nearby Homes
- 4485 River Oaks Rd
- 5158 Mill Creek Rd
- 1727 Mineral Springs Rd
- 2408 Napa Terrace
- 236 Robinwood Ln
- 319 Inland Cove Ct
- 757 Little Bluestem Dr
- 2322 Tessa Trace
- 2536 Napa Terrace
- 642 Altamonte Dr
- 663 Cypress Glen Ln
- 506 Little Cove Ln
- 1022 Chicory Trace
- 37 Hamiltons Harbor Dr Unit 613
- 629 Cypress Glen Ln
- 15 Hamiltons Bay Ct Unit 937
- 592 Altamonte Dr
- 481 Sandbar Point
- 1091 Chicory Trace
- 2126 Shady Pond Dr
- Lot 50 River Oaks Rd
- Lot 36 River Oaks Rd
- Lot 56 River Oaks Rd
- Lot 30 River Oaks Rd
- Lot 42 River Oaks Rd
- Lot 56 River Oaks Rd Unit 56
- Lot 58 River Oaks Rd Unit 58
- Lot 46 River Oaks Rd
- 4694 River Oaks Rd
- 4718 River Oaks Rd Unit 48
- LOT 1 River Oaks Rd
- Lot 59 River Oaks Rd
- Lot 49 River Oaks Rd
- Lot 51 River Oaks Rd
- Lot 27 River Oaks Rd
- Lot 39 River Oaks Rd
- Lot 35 River Oaks Rd
- Lot 13 River Oaks Rd
- Lot 45 River Oaks Rd
- Lot 25 River Oaks Rd
Your Personal Tour Guide
Ask me questions while you tour the home.