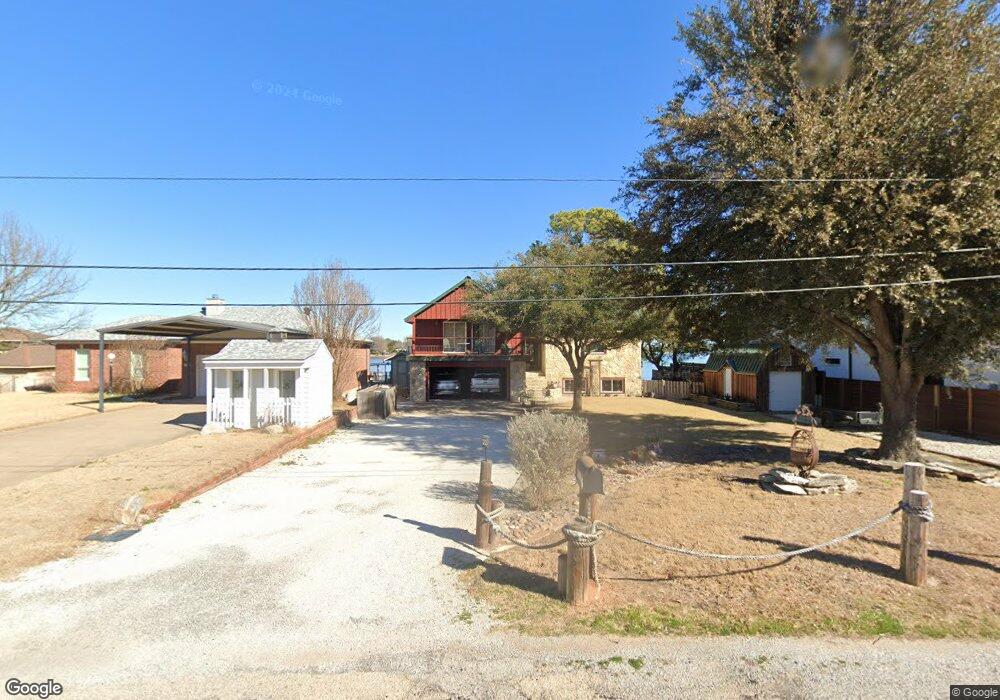
4707 E Holiday Estates Ct Granbury, TX 76049
Estimated Value: $574,000 - $751,000
2
Beds
3
Baths
1,658
Sq Ft
$390/Sq Ft
Est. Value
About This Home
This home is located at 4707 E Holiday Estates Ct, Granbury, TX 76049 and is currently estimated at $647,083, approximately $390 per square foot. 4707 E Holiday Estates Ct is a home located in Hood County with nearby schools including Acton Elementary School, Acton Middle School, and Granbury High School.
Ownership History
Date
Name
Owned For
Owner Type
Purchase Details
Closed on
Apr 17, 2025
Sold by
Martin Stephen Wayne
Bought by
Read Darwin Dee and Read Shiela
Current Estimated Value
Purchase Details
Closed on
Sep 9, 2013
Sold by
Lustenhouwer Paul
Bought by
Martin Stephen Wayne
Home Financials for this Owner
Home Financials are based on the most recent Mortgage that was taken out on this home.
Original Mortgage
$250,000
Interest Rate
4.36%
Purchase Details
Closed on
Jan 8, 2001
Sold by
Pultorak Edward J and Pultorak Elsie M
Bought by
Martin Stephen Wayne
Purchase Details
Closed on
Oct 30, 1998
Sold by
Meuir Mary Lou
Bought by
Martin Stephen Wayne
Purchase Details
Closed on
Jun 30, 1997
Sold by
Meuir Mary Lou and Mc Reynolds P
Bought by
Martin Stephen Wayne
Create a Home Valuation Report for This Property
The Home Valuation Report is an in-depth analysis detailing your home's value as well as a comparison with similar homes in the area
Home Values in the Area
Average Home Value in this Area
Purchase History
| Date | Buyer | Sale Price | Title Company |
|---|---|---|---|
| Read Darwin Dee | -- | None Listed On Document | |
| Martin Stephen Wayne | -- | None Available | |
| Martin Stephen Wayne | -- | -- | |
| Martin Stephen Wayne | -- | -- | |
| Martin Stephen Wayne | -- | -- |
Source: Public Records
Mortgage History
| Date | Status | Borrower | Loan Amount |
|---|---|---|---|
| Previous Owner | Martin Stephen Wayne | $250,000 |
Source: Public Records
Tax History Compared to Growth
Tax History
| Year | Tax Paid | Tax Assessment Tax Assessment Total Assessment is a certain percentage of the fair market value that is determined by local assessors to be the total taxable value of land and additions on the property. | Land | Improvement |
|---|---|---|---|---|
| 2025 | $2,562 | $501,944 | $200,000 | $375,530 |
| 2024 | $2,647 | $456,313 | $200,000 | $532,330 |
| 2023 | $5,048 | $669,740 | $200,000 | $469,740 |
| 2022 | $4,427 | $687,850 | $170,000 | $517,850 |
| 2021 | $5,263 | $342,840 | $130,000 | $212,840 |
| 2020 | $5,362 | $345,280 | $130,000 | $215,280 |
| 2019 | $5,284 | $325,000 | $130,000 | $195,000 |
| 2018 | $4,902 | $301,510 | $130,000 | $171,510 |
| 2017 | $4,609 | $275,590 | $130,000 | $145,590 |
| 2016 | $4,412 | $263,820 | $123,500 | $140,320 |
| 2015 | $4,954 | $273,590 | $104,000 | $169,590 |
| 2014 | $4,954 | $299,030 | $104,000 | $195,030 |
Source: Public Records
Map
Nearby Homes
- 4604 E Holiday Estates Ct
- 3708 Coral Sands Ct
- 4603 Rendezvous Ct
- 4309 Davis Rd
- 4200 Bar Harbor Ct
- 4109 Newport Bay Ct
- 3711 Indian Creek Trail
- 8088 Brownie Luker Blvd
- 3713 Indian Creek Trail
- 3816 Winding Way
- 741 R C Luker Ct
- 4400 Power Plant Ct
- 735 R C Luker Ct
- 4306 Chicken Gristle Rd
- 4342 Chicken Gristle Rd
- 8053 Brownie Luker Blvd
- 9042 Brownie Luker Blvd
- 8056 Brownie Luker Blvd
- 9006 Brownie Luker Blvd
- 8032 Brownie Luker Blvd
- 4709 E Holiday Estates Ct
- 4711 E Holiday Estates Ct
- 4703 E Holiday Estates Ct
- 4706 E Holiday Estates Ct
- 4701 E Holiday Estates Ct
- 4708 E Holiday Estates Ct
- 4704 E Holiday Estates Ct
- 4712 E Holiday Estates Ct
- 4715 E Holiday Estates Ct
- 4716 E Holiday Estates Ct
- 4622 E Holiday Estates Ct
- 4625 E Holiday Estates Ct
- 4718 E Holiday Estates Ct
- 4717 E Holiday Estates Ct
- 4623 E Holiday Estates Ct
- 4620 E Holiday Estates Ct
- 4724 E Holiday Estates Ct
- 4621 E Holiday Estates Ct
- 4719 E Holiday Estates Ct
- 4726 E Holiday Estates Ct